
- Title
-
Zebrafish functional xenograft vasculature platform identifies PF-502 as a durable vasculature normalization drug
- Authors
- Zhong, J., Xiao, C., Chen, Q., Pan, X., Xu, T., Wang, Y., Hou, W., Liu, L., Cao, F., Wang, Y., Li, X., Zhou, L., Yang, H., Yang, Y., Zhao, C.
- Source
- Full text @ iScience
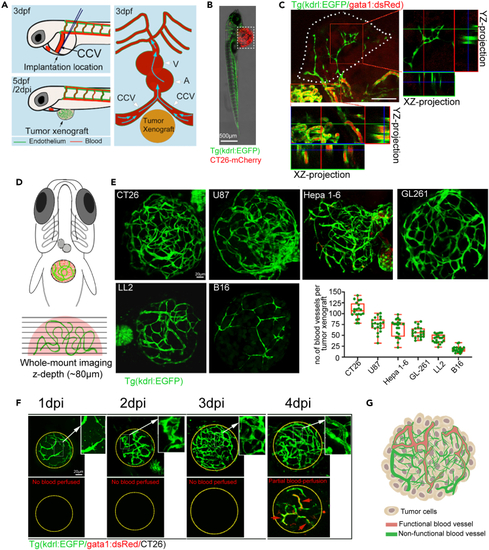
Functionalization of tumor vasculature of the xenografts in zebrafish larvae (A) Schematic diagram of tumor implantation into the perivitelline space (PVS) between the common cardinal veins (CCV) of 3 dpf zebrafish embryos. (dpf: days post fertilization, dpi: days post-implantation, V: ventricle, A: atrium). Scale bars: 500 μm. (B) Representative fluorescence stereomicroscope image showing the red CT26-mCherry xenograft (dotted box) in a 2 dpi kdrl:EGFP zebrafish. Scale bars: 50 μm. (C) Maximum intensity projection of the angiogenic sprouts in the CT26 xenograft on a 2 dpi kdrl:EGFP zebrafish with dextran-red angiography. Scale bars: 50 μm. (D) The schematic diagram of imaging the vasculature of xenografts using Confocal microscope. (E) Maximum intensity projection of the tumor vasculature from various tumor xenografts (CT26, Hepa1-6, U87, Gl261, LL2 and B16) in 3 dpi kdrl:EGFP zebrafish. The graphical representation depicts the quantitative analysis of blood vessel density within zebrafish xenografts. Scale bars: 20 μm. (F) Live time course of the tumor vasculature from 1 to 4 dpi with colabeled endothelial cells (ECs) and red blood cells (gata1:dsRed/kdrl:EGFP). The magnified areas are indicated by white arrows, while the lumenized and blood-perfused tumor vessels are indicated by red arrows. Scale bars: 20 μm. (G) Model showing a typical tumor vasculature within the xenograft of zebrafish on 4 dpi. |
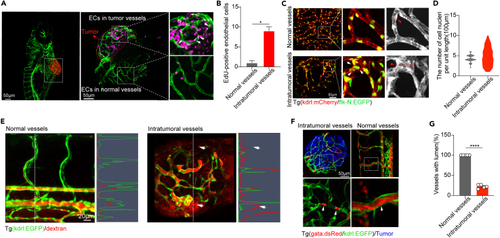
Features of tumor vasculature of the xenografts in zebrafish larvae (A) EdU-positive endothelial cells (white arrows) in normal tissue and tumor xenograft (red dotted box) at 3 dpi. The areas in white rectangles are magnified to the right. Scale bars: 50 μm. (B) The number of EdU-positive endothelial cells, (n = 3). Data are expressed as means +SEM. ∗p < 0.5, Student’s t test. (C) In the kdrl:mCherry/flk-N:EGFP double transgenic zebrafish, the maximum intensity projection of vasculature in the brain and tumor xenografts on the 3rd day post-transplantation (3 dpi) illustrates the spatial distribution of endothelial cells (white arrows). The regions within the white rectangles are magnified on the right. White arrows indicate clusters of endothelial nuclei. Additionally, red arrows and dashed lines in the grayscale image indicate areas of abnormal widened lumina. Scale bars: 50 μm. (D) The statistical graph displays the distribution of nuclei in tumor blood vessel and normal blood vessel endothelial cells. The y axis represents the number of nuclei per 100 μm of blood vessel length, and a wider range on the y axis indicates uneven distribution of endothelial cell nuclei on the blood vessel. (cell nuclei/100 μm) (n = 5). (E) Maximum intensity projection of the vasculature in the trunk and tumor xenograft with dextran-tomato (70k MW)-mediated angiography on 3 dpi kdrl:EGFP zebrafish. The intensity of the fluorescent signaling of dextran-rhodamine and EGFP on the dotted white lines in the images are shown on the right. White arrows indicate dextran-rhodamine signaling outside of EGFP signaling, suggesting leakage. Scale bars: 20 μm. (F) Maximum intensity projection of vasculature in the trunk and tumor xenograft on 3 dpi gata1:dsRed/kdrl:EGFP double transgenic zebrafish showing flowing blood red cells (white arrows) in neo-vessels. The areas in white rectangles are magnified to the right. Implanted tumor xenograft was labeled with BFP. Scale bars: 50 μm. (G) Percentages of blood perfusion in tumor vessels. Data are expressed as means +SEM. ∗∗∗∗p < 0.0001, Student’s t test. |
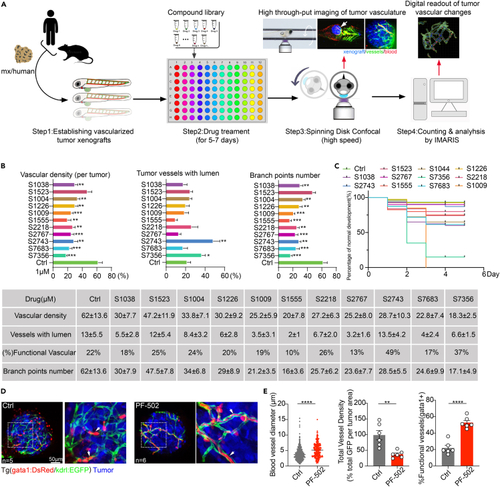
Parallel testing of potential tumor vascular normalization chemicals using zFXVP-VAST-Imaris platform (A) Schematic diagram showing the process of screening tumor vascular normalization drugs using zFXVP-VAST-Imaris platform. The white arrow indicates imaged xenografts which are magnified on the right. (B) Statistics of vascular density, the ratio of blood-perfused vessels and vascular branch points of tumor xenografts treated or not treated with the 11 chemical candidates. Quantitative numbers are summarized below. Data are expressed as means +SEM. ∗∗∗∗p < 0.0001, ∗∗p < 0.01, ∗p < 0.05. Student’s t test. (C) The curves represent the percentage of normal development in zebrafish after 5 days of continuous treatment with candidate compounds (1 μM) or an equivalent amount of solvent. n = 20. (D) Maximum intensity projection of the tumor vasculature in the xenografts with or without PF-502 (S2743) treatment on 3 dpi gata1:dsRed/kdrl:EGFP double transgenic zebrafish showing flowing red blood cells (white arrows) in neo-vessels. Areas in dotted boxes are magnified right. Scale bars: 50 μm. (E) Vessel diameters, blood vessel densities and percentages of functional vessels in tumor xenografts with or without PF-502 treatment, Data are expressed as means +SEM. ∗∗∗∗p < 0.0001, ∗∗p < 0.01. Student’s t test. |

Comparison of PF-502 with nintedanib (a VEGFR2 TKI) on the duration of tumor vascular normalization (A) Maximum intensity projection of the tumor vasculature in the xenografts with or without drug (PF-502 and nintedanib) treatments on 3 dpi gata1:dsRed/kdrl:EGFP double transgenic zebrafish. Drugs were applied for 3 days from 3 dpi to 6 dpi. Scale bars: 20 μm. (B) Graphs showing the vessel density, and percentages of lumenized and blood-perfused vessels in the tumor xenografts on 3 dpi were treated with PF-502 and nintedanib. (C) Graphs showing the percentages of lumenized vessels in the tumor xenografts on 3dpi were treated with PF-502 and nintedanib. Data are expressed as means +SEM. ∗∗∗∗p < 0.0001. Student’s t test. (D) Graphs showing the percentages of blood-perfused vessels in the tumor xenografts on 3dpi were treated with PF-502 and nintedanib. Data are expressed as means +SEM. ∗∗∗∗p < 0.0001. Student’s t test. (E) Maximum intensity projection of the tumor vasculature of the xenografts at 1, 3, 5, 7, and 9 dpi on kdrl:EGFP transgenic zebrafish. PF-502 (1 μM) and nintedanib (1 μM) drug treatment started from 2 dpi. White arrows indicate lumenized blood vessels. Scale bars: 20 μm. (F) Graph showing the percentage of lumenized blood vessels in the tumor xenografts treated with PF-502 (1 μM) and nintedanib (1 μM) at the indicated time points. Dotted lines between two arrows indicate the normalization window of individual drugs, and the green dotted lines indicate the ratio of lumenized vessels in xenografts without drug treatment. |

PF-502 induces cell-cycle arrest and inhibits endothelial (pHUVEC) proliferation in vivo and in vitro (A) Cell viability of CT26 and pHUVECs was assessed after treated with PF-502(0–10 μΜ) for 24 h. (B) The ratio of EdU-positive endothelial cells in pHUVECs with or without PF-502 (0.15 μM for 24 h) treatment. The EdU-positive endothelial cells were analyzed by ImageJ. Scale bars: 50 μm. Data are expressed as means +SEM. ∗∗∗p < 0.001. Student’s t test. (C) Maximum intensity projection of the tumor vasculature in the xenografts with or without PF-502 (1 μM for 72 h) treatment at 3 dpi, showing the spatial distribution of endothelial cells in neo-vessels. (n = 6). Scale bars: 20 μm. (D) The density of endothelial nuclei in neo-vessels of the xenografts with or without PF-502 (1 μM for 72 h) treatment at 3 dpi. (E) GSEA showing the negative enrichment of the HALLMARK_PI3K_AKT_MTOR_SIGNALLNG (NES = −2.10; FDR q = 0.0), HALLMARK_MTORC1_SIGNALING (NES = −2.55; FDR q = 0.0), HALLMARK_G2M_CHECKPOINT (NES = −2.31; FDR q = 0.0) and HALLMARK_E2F_TARGETS (NES = −2.34; FDR q = 0.0) gene sets in pHUVECs after treatment with PF-502 (0.15 μM for 12 h). (F) KEGG analysis of the downregulated genes (1364) in pHUVECs after being treated with PF-502 (0.15 μM for 12 h) (p < 0.005). (G) Cell cycle analysis of the pHUVECs with or without PF-502 (0.15 μM for 12 h) treatment is based on the G2 M and S gene sets. |
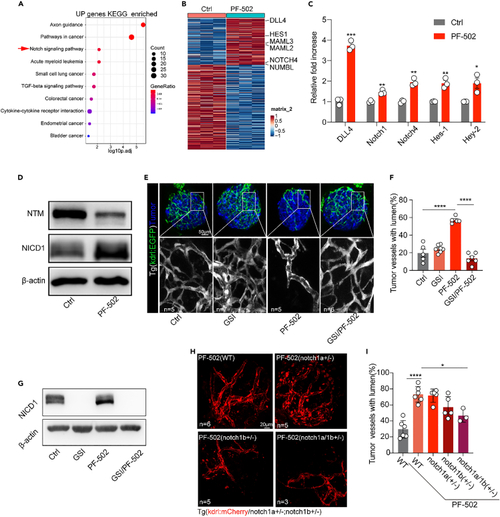
PF-502 mediates Notch S3 cleavage and activates the Notch signaling pathway in endothelial cells (A) KEGG analysis of the upregulated genes (738) in HUVECs after being treated with PF-502 (0.15 μM for 12 h) highlights the Notch signaling pathway (p < 0.05) (red arrow). (B) Heatmap depicting differentially expressed genes in HUVECs treated with or without PF-502 (0.15 μM for 12 h). (C) RT-PCR analysis of the notch-targeted transcripts DLL4, Notch1, Notch4, Hes1 and Hey2 in HUVECs with or without PF-502 (0.15 μM) treatment for 12 h. Data are expressed as means +SEM. ∗∗∗p < 0.001, ∗∗p < 0.01, ∗p < 0.05. Student’s t test. (D) The left panel shows the western blotting (WB) results of (transmembrane Notch (NTM and Notch intracellular domain (NICD) in HUVECs treated with or without PF-502 (0.15 μM) for 24 h. The right panel presents a graph indicating the relative expression levels of NTM and NICD in HUVECs after PF-502 (0.15 μM) treatment for 24 h (n = 3). (E) Maximum intensity projection of the tumor vasculature of the xenografts on 3 dpi on kdrl:EGFP transgenic zebrafish that were treated with γ-secretase inhibitor LY411575 (GSI) (10 μM for 72 h), PF-502(1 μM for 72 h) and combined. The areas in the dotted boxes are magnified below showing vasculature signaling in the gray channel. Scale bars: 50 μm. (F) Percentages of lumenized vessels in xenografts with or without GSI and PF-502 treatment (1 μM for 72 h) (n = 5–7). Data are expressed as means +SEM. ∗∗∗∗p < 0.0001. Student’s t test. (G) WB of NICD in HUVECs with or without drug treatment. LY411575(10 μM for 72 h), PF-502(0.15 μM for 72 h) and combined. (H) Maximum intensity projection of the tumor vasculature of the xenografts on 3 dpi on kdrl:mCherry transgenic zebrafish with indicated notch mutations. Zebrafish were all treated with PF-502 (1 μM for 72 h). Scale bars: 20 μm. (I) Graph showing the percentage of lumenized blood vessels in xenografts at 3 dpi on kdrl:mCherry transgenic zebrafish with the indicated notch mutations treated with PF-502 (1 μM for 72 h). Data are expressed as means +SEM. ∗∗∗∗p < 0.0001, ∗p < 0.05. Student’s t test. |
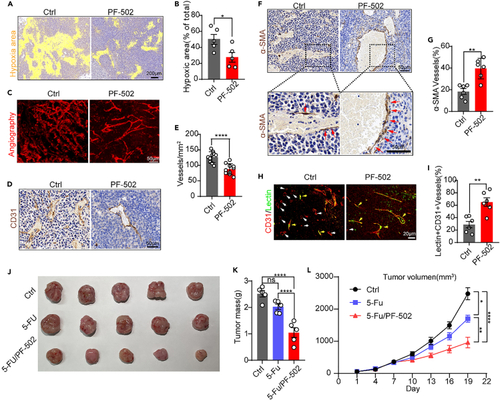
PF-502 structurally and functionally normalizes the tumor vasculature of mouse xenografts and significantly synergizes with the anti-tumor effect of fluorouracil (5-FU) (A) Pimonidazole staining of hypoxic areas of tumor xenografts with or without PF-502 treatment. The hypoxic area (yellow) was rendered by Imaris software. Scale bars: 200 μm. (B) The graph shows the percentage of hypoxic area in the tumor xenograft with or without PF-502 treatment. Data are expressed as means +SEM. ∗p < 0.05. Student’s t test. (C) Volume staining (depth = 200 μm) of tumor vasculature of CT26 xenografts on mice treated with or without PF-502 (5 mg/kg, once daily for 18 days), showing the tortuous vasculature in control xenografts and simplified vasculature in drug-treated xenografts. Scale bars: 50 μm. (D) Immunohistochemistry (IHC) of CD31 of CT26 xenografts on mice treated with or without PF-502 (5 mg/kg, once daily for 18 days). White arrows indicate micro-blood vessels. Scale bars: 50 μm. (E) Graph showing the density of blood vessel densities in the CT26 xenografts with or without PF-502-treatment (n = 5), Data are expressed as means +SEM. ∗∗∗∗p < 0.0001. Student’s t test. (F) Immunohistochemistry (IHC) of α-SMA in CT26 xenografts from mice treated with or without PF-502 (5 mg/kg, once daily for 18 days). Areas in boxes are magnified below. Red arrows indicate α-SMA pericytes. Scale bars: 50 μm. (G) The graph shows the percentage of endothelial cell vessels with pericyte coverage. Data are expressed as means +SEM. ∗∗p < 0.01. Student’s t test. (H) Immunofluorescence (IF) of CD31 with FITC-Lectin perfusion assay showing the blood-perfused (Lectin+/CD31+) (yellow arrows) and non-perfused (Lectin-/CD31+) (white arrows) vessels in tumor xenografts with or without PF-502 (5 mg/kg, once daily for 18 days) treatment. Scale bars: 20 μm. (I) Graph showing the percentage of blood-perfused vessels in the tumor xenograft with or without PF-502 treatment. Data are expressed as means +SEM. ∗∗p < 0.01. Student’s t test. (J) Stripped tumor xenografts were treated with DMSO, 5-FU, or a combination of 5-FU (5 mg/kg) and PF-502(5 mg/kg/day). Drug treatments started on day 6 and continued for 12 days (until day 18). (K) Graph showing the weight of stripped xenografts with or without drug treatments. Data are expressed as means +SEM. ∗∗∗∗p < 0.0001. Student’s t test. (L) Growth curves of tumor xenografts in control and 5-FU-treated (with or without PF-502) mice. Data are expressed as means +SEM. ∗∗∗∗p < 0.0001, ∗∗p < 0.01, ∗p < 0.05. One-way ANOVA. |

|