
Fig. 1
- ID
- ZDB-FIG-231221-50
- Publication
- Zhong et al., 2023 - Zebrafish functional xenograft vasculature platform identifies PF-502 as a durable vasculature normalization drug
- Other Figures
- All Figure Page
- Back to All Figure Page
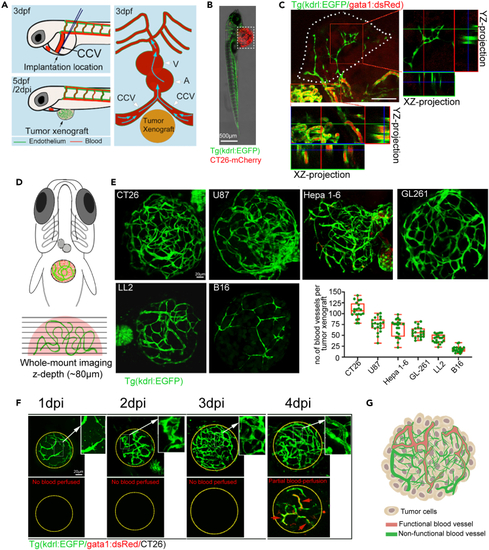
Functionalization of tumor vasculature of the xenografts in zebrafish larvae (A) Schematic diagram of tumor implantation into the perivitelline space (PVS) between the common cardinal veins (CCV) of 3 dpf zebrafish embryos. (dpf: days post fertilization, dpi: days post-implantation, V: ventricle, A: atrium). Scale bars: 500 μm. (B) Representative fluorescence stereomicroscope image showing the red CT26-mCherry xenograft (dotted box) in a 2 dpi kdrl:EGFP zebrafish. Scale bars: 50 μm. (C) Maximum intensity projection of the angiogenic sprouts in the CT26 xenograft on a 2 dpi kdrl:EGFP zebrafish with dextran-red angiography. Scale bars: 50 μm. (D) The schematic diagram of imaging the vasculature of xenografts using Confocal microscope. (E) Maximum intensity projection of the tumor vasculature from various tumor xenografts (CT26, Hepa1-6, U87, Gl261, LL2 and B16) in 3 dpi kdrl:EGFP zebrafish. The graphical representation depicts the quantitative analysis of blood vessel density within zebrafish xenografts. Scale bars: 20 μm. (F) Live time course of the tumor vasculature from 1 to 4 dpi with colabeled endothelial cells (ECs) and red blood cells (gata1:dsRed/kdrl:EGFP). The magnified areas are indicated by white arrows, while the lumenized and blood-perfused tumor vessels are indicated by red arrows. Scale bars: 20 μm. (G) Model showing a typical tumor vasculature within the xenograft of zebrafish on 4 dpi. |