
|
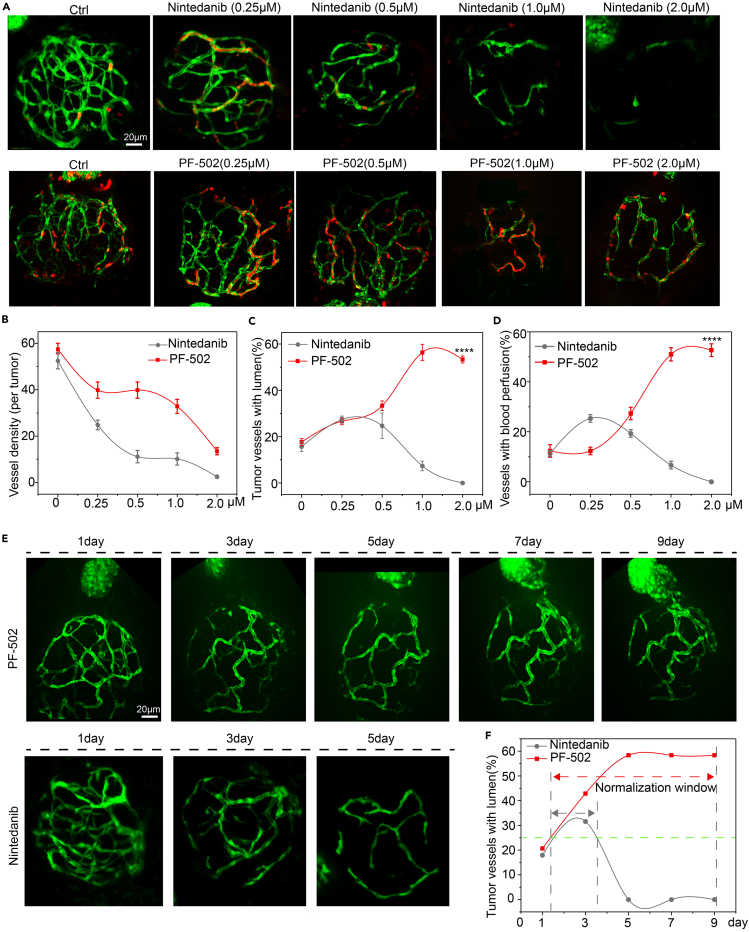
Fig. 4 Comparison of PF-502 with nintedanib (a VEGFR2 TKI) on the duration of tumor vascular normalization (A) Maximum intensity projection of the tumor vasculature in the xenografts with or without drug (PF-502 and nintedanib) treatments on 3 dpi gata1:dsRed/kdrl:EGFP double transgenic zebrafish. Drugs were applied for 3 days from 3 dpi to 6 dpi. Scale bars: 20 μm. (B) Graphs showing the vessel density, and percentages of lumenized and blood-perfused vessels in the tumor xenografts on 3 dpi were treated with PF-502 and nintedanib. (C) Graphs showing the percentages of lumenized vessels in the tumor xenografts on 3dpi were treated with PF-502 and nintedanib. Data are expressed as means +SEM. ∗∗∗∗p < 0.0001. Student’s t test. (D) Graphs showing the percentages of blood-perfused vessels in the tumor xenografts on 3dpi were treated with PF-502 and nintedanib. Data are expressed as means +SEM. ∗∗∗∗p < 0.0001. Student’s t test. (E) Maximum intensity projection of the tumor vasculature of the xenografts at 1, 3, 5, 7, and 9 dpi on kdrl:EGFP transgenic zebrafish. PF-502 (1 μM) and nintedanib (1 μM) drug treatment started from 2 dpi. White arrows indicate lumenized blood vessels. Scale bars: 20 μm. (F) Graph showing the percentage of lumenized blood vessels in the tumor xenografts treated with PF-502 (1 μM) and nintedanib (1 μM) at the indicated time points. Dotted lines between two arrows indicate the normalization window of individual drugs, and the green dotted lines indicate the ratio of lumenized vessels in xenografts without drug treatment.