
Fig. 2
- ID
- ZDB-FIG-231221-51
- Publication
- Zhong et al., 2023 - Zebrafish functional xenograft vasculature platform identifies PF-502 as a durable vasculature normalization drug
- Other Figures
- All Figure Page
- Back to All Figure Page
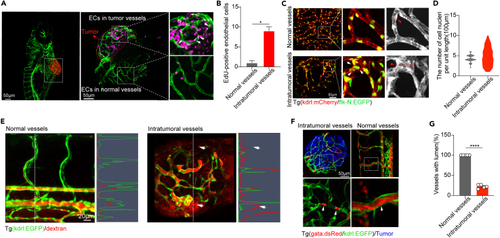
Features of tumor vasculature of the xenografts in zebrafish larvae (A) EdU-positive endothelial cells (white arrows) in normal tissue and tumor xenograft (red dotted box) at 3 dpi. The areas in white rectangles are magnified to the right. Scale bars: 50 μm. (B) The number of EdU-positive endothelial cells, (n = 3). Data are expressed as means +SEM. ∗p < 0.5, Student’s t test. (C) In the kdrl:mCherry/flk-N:EGFP double transgenic zebrafish, the maximum intensity projection of vasculature in the brain and tumor xenografts on the 3rd day post-transplantation (3 dpi) illustrates the spatial distribution of endothelial cells (white arrows). The regions within the white rectangles are magnified on the right. White arrows indicate clusters of endothelial nuclei. Additionally, red arrows and dashed lines in the grayscale image indicate areas of abnormal widened lumina. Scale bars: 50 μm. (D) The statistical graph displays the distribution of nuclei in tumor blood vessel and normal blood vessel endothelial cells. The y axis represents the number of nuclei per 100 μm of blood vessel length, and a wider range on the y axis indicates uneven distribution of endothelial cell nuclei on the blood vessel. (cell nuclei/100 μm) (n = 5). (E) Maximum intensity projection of the vasculature in the trunk and tumor xenograft with dextran-tomato (70k MW)-mediated angiography on 3 dpi kdrl:EGFP zebrafish. The intensity of the fluorescent signaling of dextran-rhodamine and EGFP on the dotted white lines in the images are shown on the right. White arrows indicate dextran-rhodamine signaling outside of EGFP signaling, suggesting leakage. Scale bars: 20 μm. (F) Maximum intensity projection of vasculature in the trunk and tumor xenograft on 3 dpi gata1:dsRed/kdrl:EGFP double transgenic zebrafish showing flowing blood red cells (white arrows) in neo-vessels. The areas in white rectangles are magnified to the right. Implanted tumor xenograft was labeled with BFP. Scale bars: 50 μm. (G) Percentages of blood perfusion in tumor vessels. Data are expressed as means +SEM. ∗∗∗∗p < 0.0001, Student’s t test. |