
Fig. 7
- ID
- ZDB-FIG-231221-56
- Publication
- Zhong et al., 2023 - Zebrafish functional xenograft vasculature platform identifies PF-502 as a durable vasculature normalization drug
- Other Figures
- All Figure Page
- Back to All Figure Page
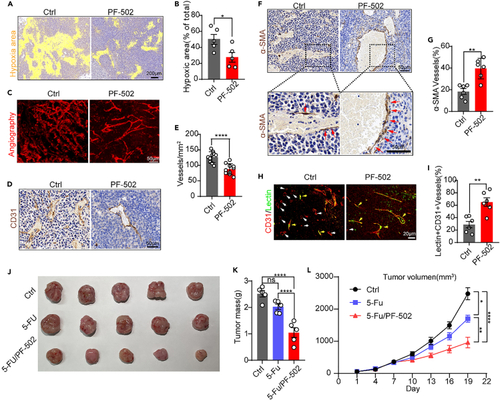
PF-502 structurally and functionally normalizes the tumor vasculature of mouse xenografts and significantly synergizes with the anti-tumor effect of fluorouracil (5-FU) (A) Pimonidazole staining of hypoxic areas of tumor xenografts with or without PF-502 treatment. The hypoxic area (yellow) was rendered by Imaris software. Scale bars: 200 μm. (B) The graph shows the percentage of hypoxic area in the tumor xenograft with or without PF-502 treatment. Data are expressed as means +SEM. ∗p < 0.05. Student’s t test. (C) Volume staining (depth = 200 μm) of tumor vasculature of CT26 xenografts on mice treated with or without PF-502 (5 mg/kg, once daily for 18 days), showing the tortuous vasculature in control xenografts and simplified vasculature in drug-treated xenografts. Scale bars: 50 μm. (D) Immunohistochemistry (IHC) of CD31 of CT26 xenografts on mice treated with or without PF-502 (5 mg/kg, once daily for 18 days). White arrows indicate micro-blood vessels. Scale bars: 50 μm. (E) Graph showing the density of blood vessel densities in the CT26 xenografts with or without PF-502-treatment (n = 5), Data are expressed as means +SEM. ∗∗∗∗p < 0.0001. Student’s t test. (F) Immunohistochemistry (IHC) of α-SMA in CT26 xenografts from mice treated with or without PF-502 (5 mg/kg, once daily for 18 days). Areas in boxes are magnified below. Red arrows indicate α-SMA pericytes. Scale bars: 50 μm. (G) The graph shows the percentage of endothelial cell vessels with pericyte coverage. Data are expressed as means +SEM. ∗∗p < 0.01. Student’s t test. (H) Immunofluorescence (IF) of CD31 with FITC-Lectin perfusion assay showing the blood-perfused (Lectin+/CD31+) (yellow arrows) and non-perfused (Lectin-/CD31+) (white arrows) vessels in tumor xenografts with or without PF-502 (5 mg/kg, once daily for 18 days) treatment. Scale bars: 20 μm. (I) Graph showing the percentage of blood-perfused vessels in the tumor xenograft with or without PF-502 treatment. Data are expressed as means +SEM. ∗∗p < 0.01. Student’s t test. (J) Stripped tumor xenografts were treated with DMSO, 5-FU, or a combination of 5-FU (5 mg/kg) and PF-502(5 mg/kg/day). Drug treatments started on day 6 and continued for 12 days (until day 18). (K) Graph showing the weight of stripped xenografts with or without drug treatments. Data are expressed as means +SEM. ∗∗∗∗p < 0.0001. Student’s t test. (L) Growth curves of tumor xenografts in control and 5-FU-treated (with or without PF-502) mice. Data are expressed as means +SEM. ∗∗∗∗p < 0.0001, ∗∗p < 0.01, ∗p < 0.05. One-way ANOVA. |