
|
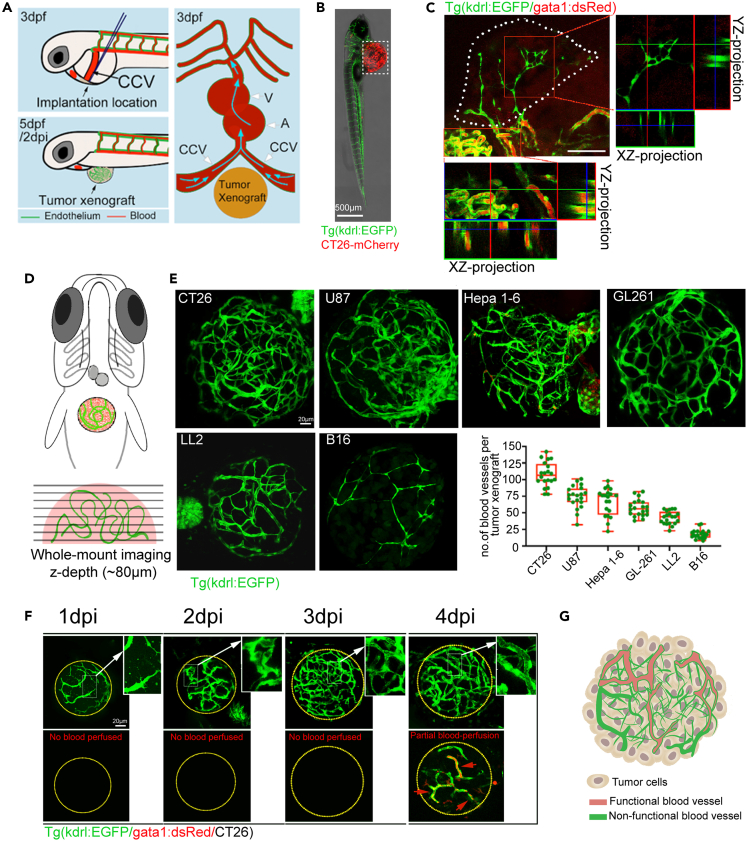
Fig. 1 Functionalization of tumor vasculature of the xenografts in zebrafish larvae (A) Schematic diagram of tumor implantation into the perivitelline space (PVS) between the common cardinal veins (CCV) of 3 dpf zebrafish embryos. (dpf: days post fertilization, dpi: days post-implantation, V: ventricle, A: atrium). Scale bars: 500 μm. (B) Representative fluorescence stereomicroscope image showing the red CT26-mCherry xenograft (dotted box) in a 2 dpi kdrl:EGFP zebrafish. Scale bars: 50 μm. (C) Maximum intensity projection of the angiogenic sprouts in the CT26 xenograft on a 2 dpi kdrl:EGFP zebrafish with dextran-red angiography. Scale bars: 50 μm. (D) The schematic diagram of imaging the vasculature of xenografts using Confocal microscope. (E) Maximum intensity projection of the tumor vasculature from various tumor xenografts (CT26, Hepa1-6, U87, Gl261, LL2 and B16) in 3 dpi kdrl:EGFP zebrafish. The graphical representation depicts the quantitative analysis of blood vessel density within zebrafish xenografts. Scale bars: 20 μm. (F) Live time course of the tumor vasculature from 1 to 4 dpi with colabeled endothelial cells (ECs) and red blood cells (gata1:dsRed/kdrl:EGFP). The magnified areas are indicated by white arrows, while the lumenized and blood-perfused tumor vessels are indicated by red arrows. Scale bars: 20 μm. (G) Model showing a typical tumor vasculature within the xenograft of zebrafish on 4 dpi.