
- Title
-
adducin 1 is essential for the survival of erythroid precursors via regulating p53 transcription in zebrafish
- Authors
- Yang, S., Cao, S., Xu, X., Li, Q., Li, J., Guo, J., Wang, F., Bao, Y., Jiang, Z., Zhang, T., Wang, L., Sun, S.
- Source
- Full text @ iScience
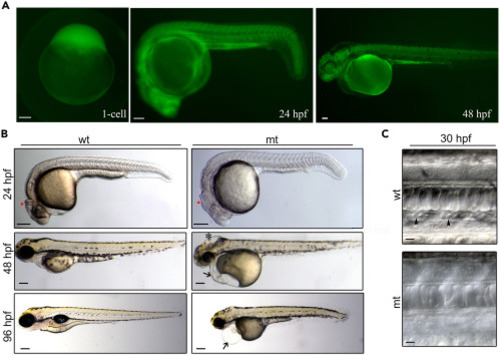
GFP expression pattern and phenotypes of add1−/− transgenic embryos (A) Fluorescent images of add1−/− embryos. GFP was expressed maternally from the 1-cell stage and ubiquitously distributed along the whole body from 24 hpf to 48 hpf. Scale bars, 100 μm. (B) Morphology of add1−/− mutant and sibling embryos. At 24 hpf, MHB was poorly developed in the homozygous mutant embryos (red triangle). Swelling of the hindbrain was observed in homozygous mutant embryos at 48 hpf (black star). Black arrow showed the trimmer head and smaller eyes in homozygous mutant embryos at 48 hpf. The mutant embryos developed edema at 96 hpf compared to siblings. Scale bars, 100 μm. (C) Bright-field microscopy of blood cells in WT and mutant embryos at 30 hpf. Some blood cells could be observed in the caudal veins of siblings at 30 hpf (black arrowheads), whereas they were almost absent in the mutants. Scale bars, 10 μm. |
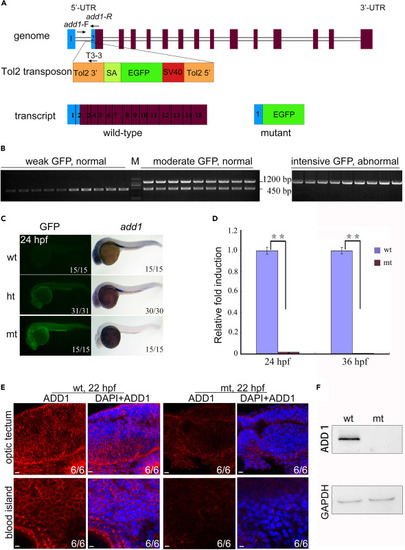
Genomic schematic and reduced expression level of add1 in add1−/− mutant embryos (A) Genomic structure of the add1 locus and putative transcripts. The Tol2 transposon was inserted into the first intron of the add1 gene. The binding positions and directions of primers add1-F, add1-R, and T3-3 used in (B) were indicated. UTR, untranslated region. (B) PCR-based genotyping of individual embryos. At 24 hpf, embryos from add1 heterozygote intercrosses were separated based on GFP intensity and phenotypes. Three primers, add1-F, add1-R, and T3-3, the Tol2-3′ element located downstream of the insertion site, were used in tandem for PCR with genomic DNA from a single embryo as the template. The mutant and WT add1 alleles were represented by 1200 and 450 bp bands, respectively. M stands for molecular marker lane. (C) Expression levels of add1 transcript in mutant embryos detected with WISH. In the left panel, wt, ht, and mt represented WT with weak GFP, heterozygote with moderate GFP, and homozygote with intensive GFP, respectively. It is worth noting that the expression level of Add1 nearly vanished. (D) qRT-PCR analysis of the relative expression level of add1 in WT and add1−/− embryos at indicated stages. β-actin was used as an internal control. Embryos were pre-sorted as mentioned above. The data were presented as mean ± SD from three independent biological repeats. Total RNA of each group was extracted from a pool of 30 embryos. ∗∗, p < 0.01 (by Student’s t test). (E and F) Expression of Add1 was dramatically reduced in add1−/− mutants. Embryos of add1−/− and their siblings were harvested at 22 hpf, and then stained with anti-Add1 antibodies. Confocal photography was used to capture the optic tectum and blood island. (E). Scale bars, 10 μm. The levels of Add1 in cell lysis of the embryos was further analyzed by western blots (F). |
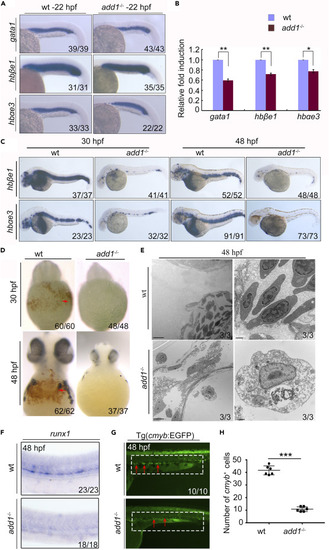
add1 is required for the primitive erythropoiesis and definitive hematopoiesis (A) Expression pattern of primitive erythropoiesis marker genes in add1 mutant embryos. The erythrocyte marker genes gata1, hbαe3 and hbβe1 were detected with WISH in add1 mutant and siblings at 22 hpf. There was a slight decrease in the expression levels of these genes in the mutants. (B) FPKM values of erythroid cell specific genes in add1−/− and siblings. (C) WISH results of erythrocyte marker genes from 36 hpf to 48 hpf. The expression levels of hbαe1 and hbβe3 in add1 mutant embryos decreased sharply in the mutant from 30 hpf to 48 hpf. (D) o-dianisidine staining for hemoglobin at indicated embryos. Left panel: Hemoglobin in red blood cells is strongly stained in WT embryos, noted prominently in the ducts of cuvier over the yolk sac (red arrow). Right panel: In contrast, there is no detectable hemoglobin staining in add1 mutant embryos. (E) Transmission electron micrographs of WT and add1−/− erythrocytes at 48 hpf. Note that erythroid cells from add1−/− heart chambers were variable in the number and morphology, the bottom looked like erythroblast. Scale bars: 5 μm (left panel); 500 nm (right panel). (F) Expression pattern of runx1 in add1−/− mutants and WT siblings. The expression level of runx1 decreased in mutant embryos at 48 hpf. (G) The EGFP signals in the mutant embryos in the background of Tg(c-myb:EGFP). The EGFP positive signals displayed an obvious reduction of HSCs compared with WT embryos at 48hpf. The red arrows indicate c-myb expression. (H) Quantification of c-myb+ HSPCs. Error bars, mean ± SD, ∗∗∗, p < 0.001. |
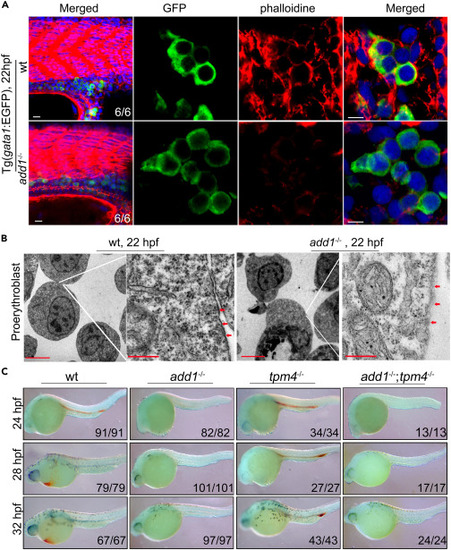
Abnormal cytoskeleton and ultrastructural analysis of the membrane of erythroblasts in add1 mutant embryos (A) Distribution of F-actin in erythroblasts. In order to display the distribution of F-actin (red) in erythroblasts, WT and mutant embryos were co-stained with phalloidin-TRITC and anti-GFP antibody at 22 hpf (green). Confocal fluorescence microscopy was used to examine the sagittal cryosections. Scale bars: 10 μm (left panel); 5 μm (right panel). (B) TEM ultrastructural examination of the proerythroblast membrane in the add1 mutant. On the right panel, labeled regions on the left panel were enlarged. The images are representative of 4 embryos each. Scale bars: 10 μm (left panel); 500 nm (right panel). (C) o-dianisidine staining of add1 mutant and double mutant of add1;tpm4 at indicated stages. Embryos were sorted to four groups by the phenotype of mutant add1 and T2EGEZ8. Embryos had no heart beat and shrinkage of yolk sac extension; smaller head and a few pigments were double mutant carried add1 and tpm4 gene. Note that there are no detectable positive signals in the double mutants just like the mutant of Add1. In T2EGEZ8 mutant, the positive signals were only found in the ICM from 24 hpf to 32 hpf. |
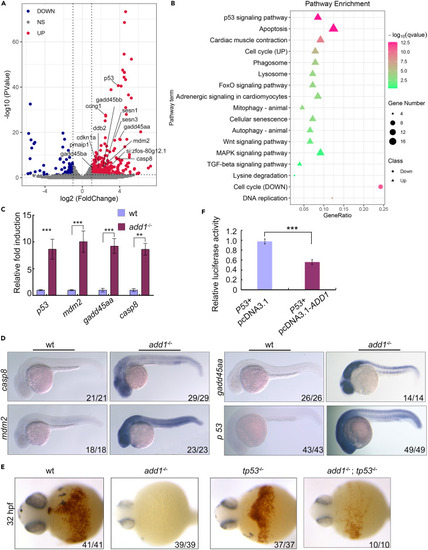
Elevated p53 is responsible for the survival of the erythroblast (A) Volcano plot of differentially expressed coding genes (DEGs) between erythroblast from add1−/− and siblings. Vertical lines correspond to 2-fold differences; horizontal line represents a p value of 0.05. Red and blue points represent DEGs with statistical significance. The differentially expressed genes enriched in p53 signaling pathway were indicated. (B) Pathway enrichment analysis identified affected in mutants. (C) The expression levels of p53 related genes were examined by qRT-PCR. The expression levels of β-actin were used as a reference to normalize the amounts of mRNAs in each group. Significance of differences: ∗∗, p < 0.01, ∗∗∗, p < 0.001 (by Student’s t test). (D) Expression pattern of p53 related genes in add1 mutant embryos detected by WISH. The expression levels of these genes were elevated in add1 mutant embryos. (E) Detection of hemoglobin in different embryos using o-dianicidine staining. Note that there are apparent positive signals in the add1;p53 double mutants embryos at the indicated stage. (F) Dural luciferase reporter assay of ADD1 regulating the p53 promoter. Confirmation of Add1 inhibiting the promoter activity of p53. ∗∗∗, p < 0.001 (by Student’s t test). |
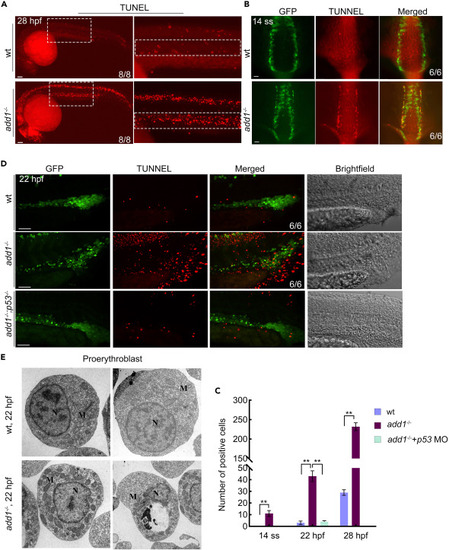
Excess apoptosis occurred in add1 mutant embryos (A) DNA fragmentation was detected by TUNEL assay. Embryos were observed by fluorescence microscopy after staining at indicated stages. Note that the mutants had more and stronger positive signals. Scale bars: 100 μm. (B) TUNEL assay in embryos under the background of Tg (gata1:EGFP) at 14-somites stage. Scale bars: 100 μm. (C) Statistical data for the number of TUNEL positive cells. The positive cells are defined by ImageJ software in 6 WT and mutant siblings. Significance of differences:∗∗, p < 0.01 (by Student’s t test). (D) TUNEL assay in embryos under the background of Tg (gata1:EGFP). The embryos of WT, add1−/− and add1−/− microinjected with p53 MO were harvested at 22 phf and conducted with TUNEL assay. The images were taken by confocal fluorescence microscopy. Scale bars: 50 μm. (E) Ultrastructure of proerythroblast in mutant embryos observed by TEM. Blood island region of WT and mutant homozygous embryos were sectioned and observed by TEM. Note that the increased number of mitochondria (indicated by arrowhead) can be seen in proerythroblast of mutant siblings in contrast with WT siblings. N, nuclear; M, mitochondria |