
|
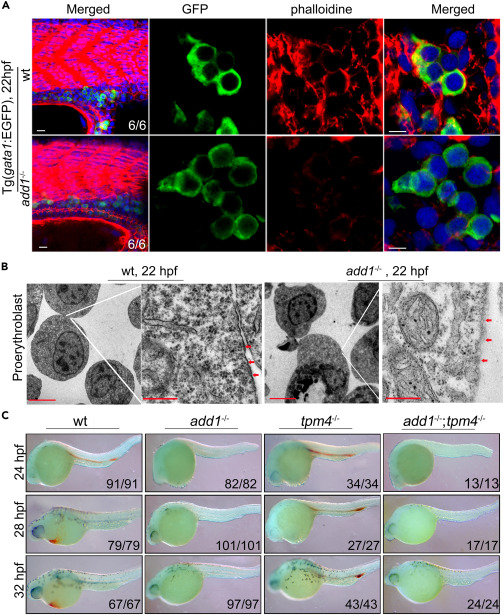
Fig. 4 Abnormal cytoskeleton and ultrastructural analysis of the membrane of erythroblasts in add1 mutant embryos (A) Distribution of F-actin in erythroblasts. In order to display the distribution of F-actin (red) in erythroblasts, WT and mutant embryos were co-stained with phalloidin-TRITC and anti-GFP antibody at 22 hpf (green). Confocal fluorescence microscopy was used to examine the sagittal cryosections. Scale bars: 10 μm (left panel); 5 μm (right panel). (B) TEM ultrastructural examination of the proerythroblast membrane in the add1 mutant. On the right panel, labeled regions on the left panel were enlarged. The images are representative of 4 embryos each. Scale bars: 10 μm (left panel); 500 nm (right panel). (C) o-dianisidine staining of add1 mutant and double mutant of add1;tpm4 at indicated stages. Embryos were sorted to four groups by the phenotype of mutant add1 and T2EGEZ8. Embryos had no heart beat and shrinkage of yolk sac extension; smaller head and a few pigments were double mutant carried add1 and tpm4 gene. Note that there are no detectable positive signals in the double mutants just like the mutant of Add1. In T2EGEZ8 mutant, the positive signals were only found in the ICM from 24 hpf to 32 hpf.