
|
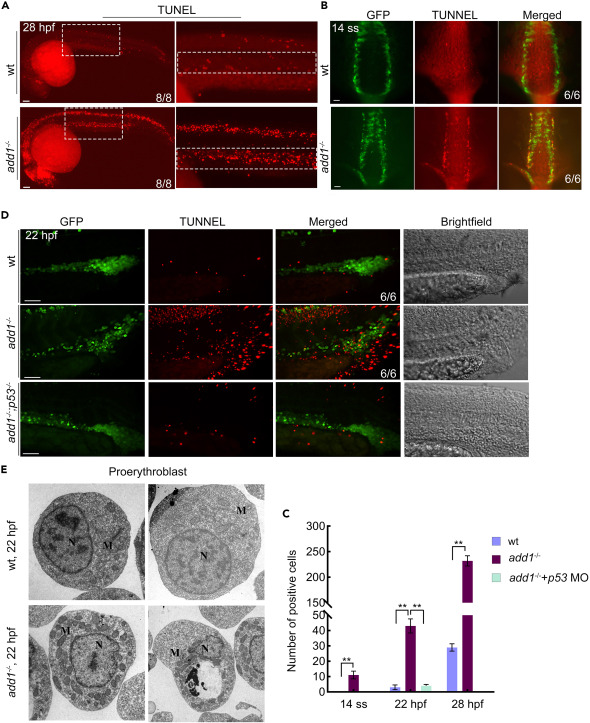
Fig. 6 Excess apoptosis occurred in add1 mutant embryos (A) DNA fragmentation was detected by TUNEL assay. Embryos were observed by fluorescence microscopy after staining at indicated stages. Note that the mutants had more and stronger positive signals. Scale bars: 100 μm. (B) TUNEL assay in embryos under the background of Tg (gata1:EGFP) at 14-somites stage. Scale bars: 100 μm. (C) Statistical data for the number of TUNEL positive cells. The positive cells are defined by ImageJ software in 6 WT and mutant siblings. Significance of differences:∗∗, p < 0.01 (by Student’s t test). (D) TUNEL assay in embryos under the background of Tg (gata1:EGFP). The embryos of WT, add1−/− and add1−/− microinjected with p53 MO were harvested at 22 phf and conducted with TUNEL assay. The images were taken by confocal fluorescence microscopy. Scale bars: 50 μm. (E) Ultrastructure of proerythroblast in mutant embryos observed by TEM. Blood island region of WT and mutant homozygous embryos were sectioned and observed by TEM. Note that the increased number of mitochondria (indicated by arrowhead) can be seen in proerythroblast of mutant siblings in contrast with WT siblings. N, nuclear; M, mitochondria