
|
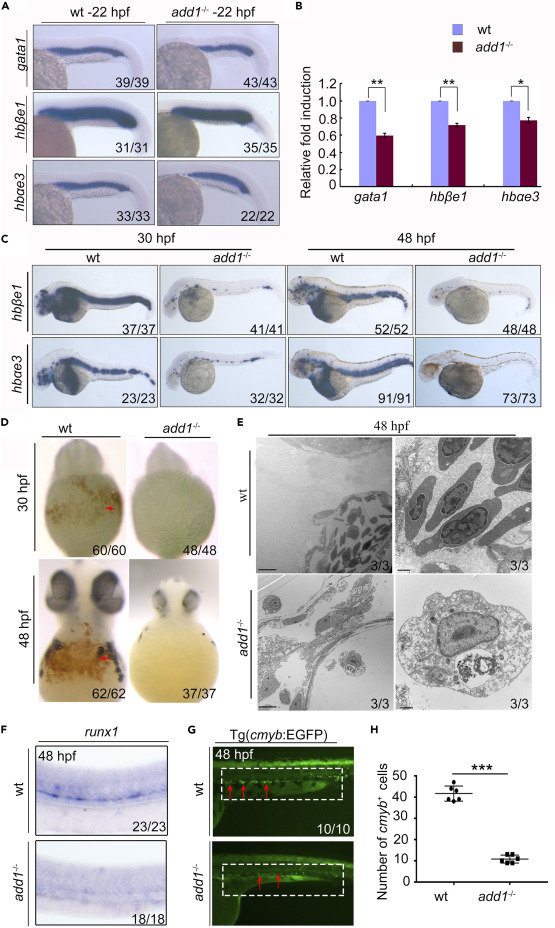
Fig. 3 add1 is required for the primitive erythropoiesis and definitive hematopoiesis (A) Expression pattern of primitive erythropoiesis marker genes in add1 mutant embryos. The erythrocyte marker genes gata1, hbαe3 and hbβe1 were detected with WISH in add1 mutant and siblings at 22 hpf. There was a slight decrease in the expression levels of these genes in the mutants. (B) FPKM values of erythroid cell specific genes in add1−/− and siblings. (C) WISH results of erythrocyte marker genes from 36 hpf to 48 hpf. The expression levels of hbαe1 and hbβe3 in add1 mutant embryos decreased sharply in the mutant from 30 hpf to 48 hpf. (D) o-dianisidine staining for hemoglobin at indicated embryos. Left panel: Hemoglobin in red blood cells is strongly stained in WT embryos, noted prominently in the ducts of cuvier over the yolk sac (red arrow). Right panel: In contrast, there is no detectable hemoglobin staining in add1 mutant embryos. (E) Transmission electron micrographs of WT and add1−/− erythrocytes at 48 hpf. Note that erythroid cells from add1−/− heart chambers were variable in the number and morphology, the bottom looked like erythroblast. Scale bars: 5 μm (left panel); 500 nm (right panel). (F) Expression pattern of runx1 in add1−/− mutants and WT siblings. The expression level of runx1 decreased in mutant embryos at 48 hpf. (G) The EGFP signals in the mutant embryos in the background of Tg(c-myb:EGFP). The EGFP positive signals displayed an obvious reduction of HSCs compared with WT embryos at 48hpf. The red arrows indicate c-myb expression. (H) Quantification of c-myb+ HSPCs. Error bars, mean ± SD, ∗∗∗, p < 0.001.