
- Title
-
AIEE-Active Flavones as a Promising Tool for the Real-Time Tracking of Uptake and Distribution in Live Zebrafish
- Authors
- Wu, Y., He, Y., Luo, H., Jin, T., He, F.
- Source
- Full text @ Int. J. Mol. Sci.
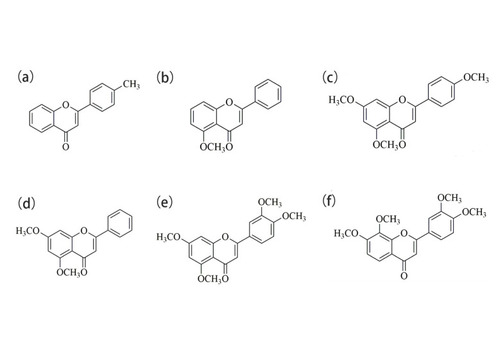
Chemical structures of compounds (a) 1, (b) 2, (c) 3, (d) 4, (e) 5, and (f) 6. |
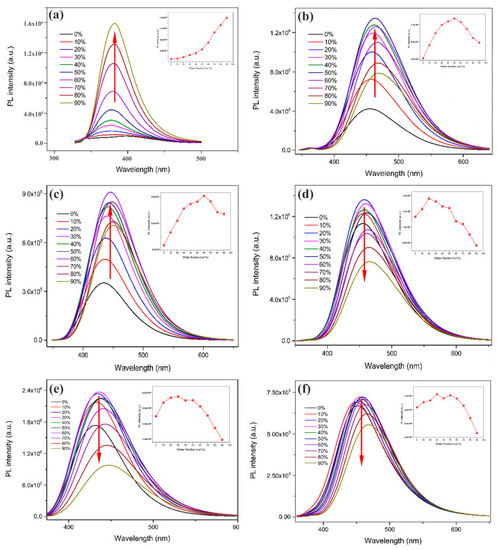
PL spectra of compounds (a) 1, (b) 2, (c) 3, (d) 4, (e) 5, and (f) 6 in CH3OH/H2O mixed solutions (c = 2.07 × 10⁻⁵ M) with different water fractions (0–90%). |
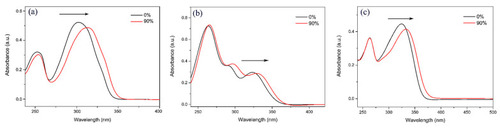
UV–vis absorption spectra of compounds (a) 1, (b) 2, and (c) 3 in pure CH3OH solution and CH3OH/H2O mixed solution with 90% water contents. |
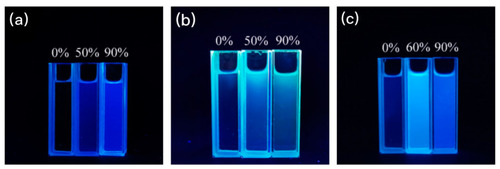
Fluorescence photographs of compounds (a) 1, (b) 2, and (c) 3 in CH3OH/H2O mixed solution (with various water fractions) under 365 nm wavelength UV light. |
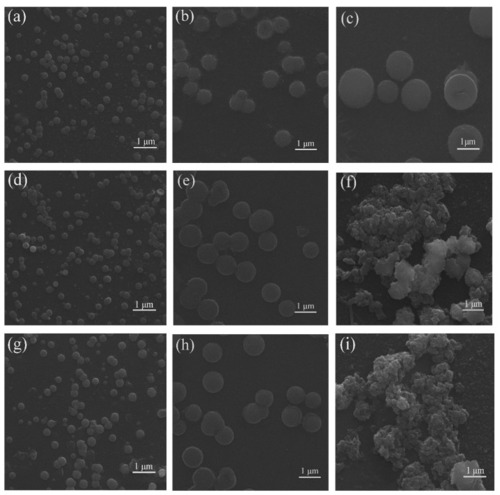
(a–c), (d–f) and (g–i) are SEM images of compound 1, 2, and 3, respectively; and the first column is of CH3OH/H2O (5:5 v:v), the second (4:6 v:v), and the third (1:9 v:v). |
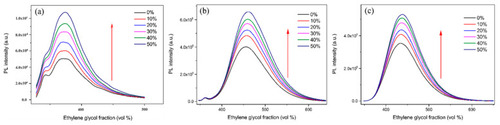
Fluorescence intensity of compounds (a) 1, (b) 2, and (c) 3 in CH3OH/EG mixed solutions with different EG fractions (0–50%). |
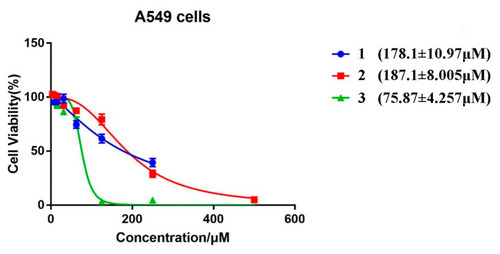
Cell viabilities of A549 cells co-incubated with different concentrations of compounds 1–3. |
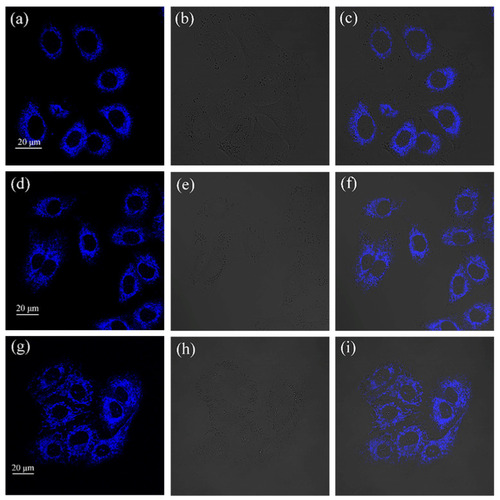
The imaging figures of A549 cells incubated with compounds (a) 1, (d) 2, and (g) 3 for 30 min with excitation at 405 nm. The bright-field images of A549 cells incubated with (b) |
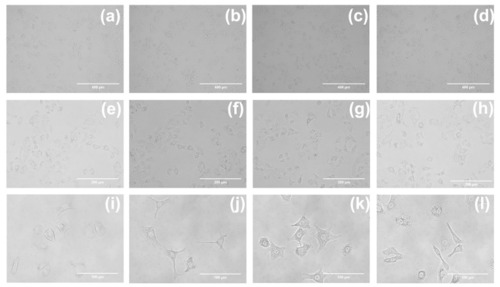
The morphological images of A549 cells. (a,e,i) The images of untreated control. The imaging figures of A549 cells incubated with compounds 1 (b,f,j), 2 (c,g,k), and 3 (d,h,l) for 24 h. ( |
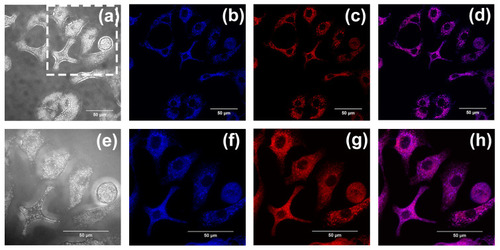
(a,e) The bright-field images of A549 cells incubated with compound 1. Co-localized images of A549 cells incubated with compound 1 (20 µM) (b,f) and Mito Tracker Red (200 nM) (c,g) for 30 min. (d,h) The merged images co-cultured with compound 1. The excitation wavelength of compound 1 was 405 nm. The excitation wavelength of Mito Tracker Red was 578 nm. (a–d) were taken with the confocal laser scanning microscope under a 60-fold lens, and (e–h) were taken under a 100-fold oil immersion lens. (e–h) are enlarged images of the dashed-square in (a). Scale bars, 50 µm. |
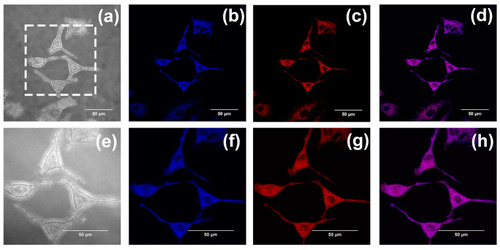
(a,e) The bright-field images of A549 cells incubated with compound 2. Co-localized images of A549 cells incubated with compound 2 (20 µM) (b,f) and Mito Tracker Red (200 nM) (c,g) for 30 min. (d,h) The merged images co-cultured with compound 2. The excitation wavelength of compound 2 was 405 nm. The excitation wavelength of Mito Tracker Red was 578 nm. (a–d) were taken using the confocal laser scanning microscope under a 60-fold lens, and (e–h) were taken under a 100-fold oil immersion lens. (e–h) are enlarged images of the dashed-square in (a). Scale bars, 50 µm. |
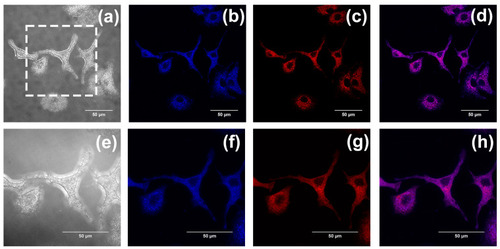
(a,e) The bright-field images of A549 cells incubated with compound 3. Co-localized images of A549 cells incubated with compound 3 (20 µM) (b,f) and Mito Tracker Red (200 nM) (c,g) for 30 min. (d,h) The merged images co-cultured with compound 3. The excitation wavelength of compound 3 was 405 nm. The excitation wavelength of Mito Tracker Red was 578 nm. (a–d) were taken using the confocal laser scanning microscope under a 60-fold lens, and (e–h) were taken under a 100-fold oil immersion lens. (e–h) are enlarged images of the dashed-square in (a). Scale bars, 50 µm. |
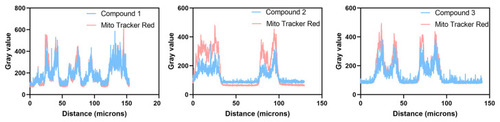
The Plot Profile of compounds 1–3. |
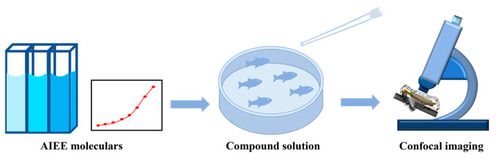
Experimental procedure. |
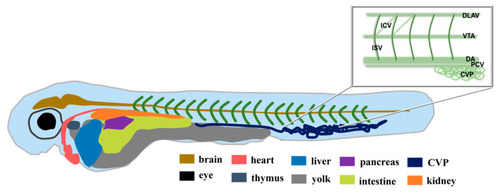
Structural sketch of zebrafish. DLAV, dorsal longitudinal anastomotic vessels; ICV, intercostal vessels; VTA, vertebral arteries; ISV, intersegmental vessels; DA, dorsal aorta; PCV, posterior cardinal vein; CVP, caudal vein capillary plexus. |
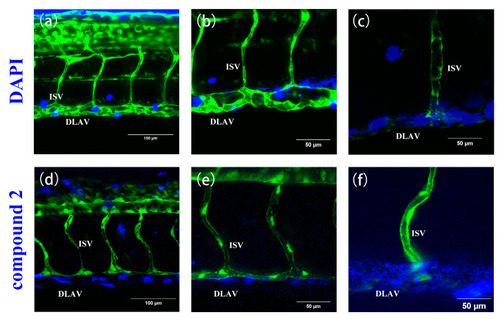
The fluorescence images of Tg(fli1a:EGFP) after incubation, respectively, with DAPI (10 µg/mL) (a–c) and compound 2 (40 µM) (d–f) for 1 h at 48 hpf. Compound 2 and DAPI exhibit similar permeability and both emit strong blue fluorescence. Zebrafish blood vessels are characterized by green fluorescence. Scale bars, 100 µm (a,d), 50 µm (b,c,e,f). |
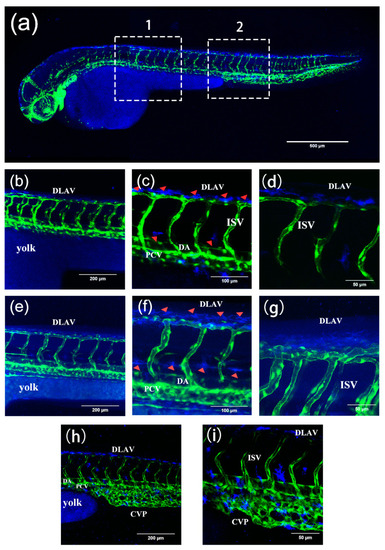
(a) The 3D images of zebrafish trunk vessels. (b–g) and (h,i) are enlarged images of areas 1 and 2 in ( |
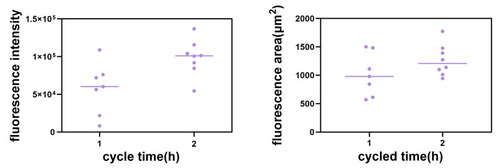
Fluorescence intensity of compound 2 cycled for 1 h and 2 h, respectively, and fluorescence area of compound 2 cycled for 1 h and 2 h, respectively. The number of dots in Figure 18 corresponds to the red triangles in Figure 17. |
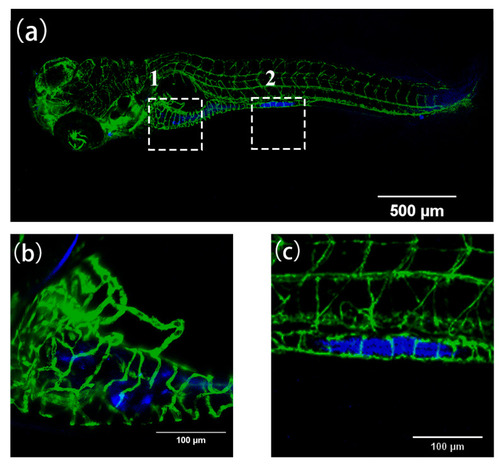
(a) The fluorescence images of Tg(fli1a:EGFP) after incubation with compound 2 (40 µM) for 2 h at 168 hpf. (b) and (c) are enlarged images of areas 1 and 2 in (a), respectively. Zebrafish blood vessels are characterized by green fluorescence. Scale bars, 500 µm (a), 100 µm (b,c). |
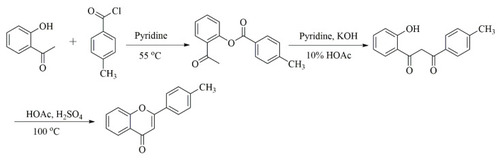
Synthetic route and chemical structures of 4′-methyflavanone. |