
Image
|
Figure Caption
Figure 19
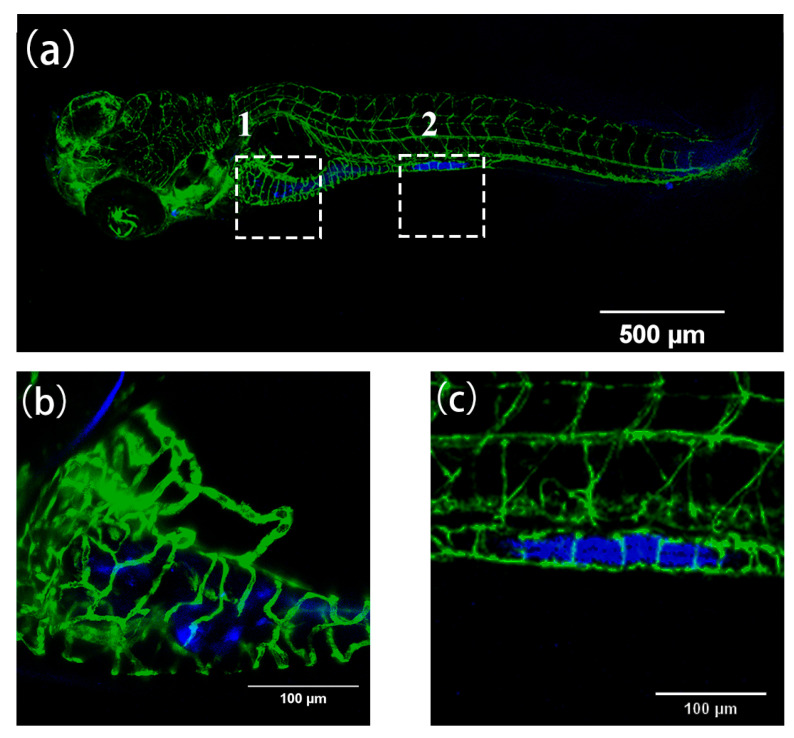
(a) The fluorescence images of Tg(fli1a:EGFP) after incubation with compound 2 (40 µM) for 2 h at 168 hpf. (b) and (c) are enlarged images of areas 1 and 2 in (a), respectively. Zebrafish blood vessels are characterized by green fluorescence. Scale bars, 500 µm (a), 100 µm (b,c).
Acknowledgments
This image is the copyrighted work of the attributed author or publisher, and
ZFIN has permission only to display this image to its users.
Additional permissions should be obtained from the applicable author or publisher of the image.
Full text @ Int. J. Mol. Sci.