FIGURE

Figure 17

ID
ZDB-FIG-230630-168
Publication
Wu et al., 2023 - AIEE-Active Flavones as a Promising Tool for the Real-Time Tracking of Uptake and Distribution in Live Zebrafish
Other Figures
All Figure Page
Back to All Figure Page
Figure 17

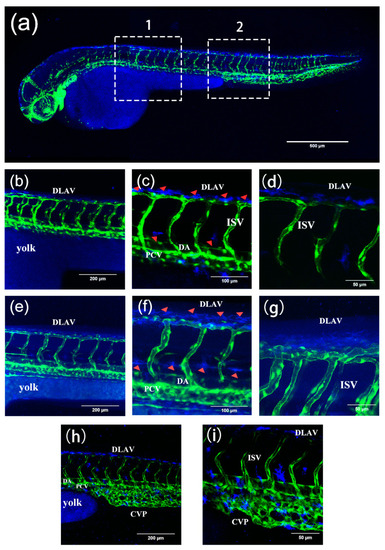
(a) The 3D images of zebrafish trunk vessels. (bg) and (h,i) are enlarged images of areas 1 and 2 in (a), respectively. (bd) Fluorescence images of Tg(fli1a:EGFP) after incubation with compound 2 (40 µM) for 1 h in 48 hpf larvae. In (c), most of the compounds adhere to the surface of the blood vessels, and a few enter the blood vessels. (eg) Fluorescence images of Tg(fli1a:EGFP) after incubation with compound 2 (40 µM) for 2 h at 48 hpf. Arrowheads in (c,f) indicate that compound 2 adheres to the surface of the blood vessels. In (f), the amount of compound absorbed into the blood vessels is greatly increased. In (h,i), compound 2 enters the CVP. Zebrafish blood vessels are characterized by green fluorescence. Scale bars, 500 µm (a), 200 µm (b,e,h), 100 µm (c,f), and 50 µm (d,g,i).

Expression Data

Expression Detail
Antibody Labeling
Phenotype Data

Phenotype Detail
Acknowledgments
This image is the copyrighted work of the attributed author or publisher, and ZFIN has permission only to display this image to its users. Additional permissions should be obtained from the applicable author or publisher of the image. Full text @ Int. J. Mol. Sci.