
Image
|
Figure Caption
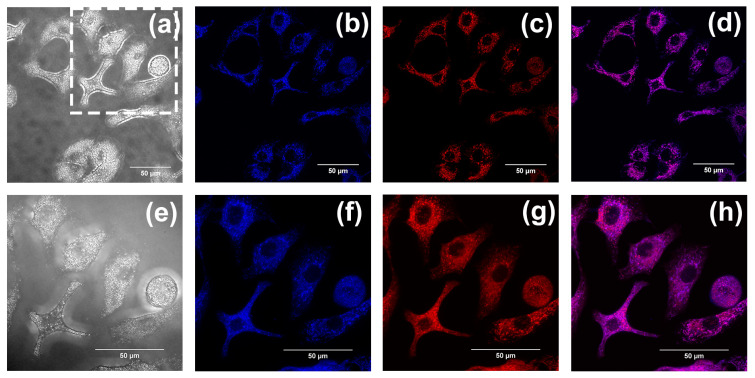
Figure 10
(a,e) The bright-field images of A549 cells incubated with compound 1. Co-localized images of A549 cells incubated with compound 1 (20 µM) (b,f) and Mito Tracker Red (200 nM) (c,g) for 30 min. (d,h) The merged images co-cultured with compound 1. The excitation wavelength of compound 1 was 405 nm. The excitation wavelength of Mito Tracker Red was 578 nm. (a–d) were taken with the confocal laser scanning microscope under a 60-fold lens, and (e–h) were taken under a 100-fold oil immersion lens. (e–h) are enlarged images of the dashed-square in (a). Scale bars, 50 µm.
Acknowledgments
This image is the copyrighted work of the attributed author or publisher, and
ZFIN has permission only to display this image to its users.
Additional permissions should be obtained from the applicable author or publisher of the image.
Full text @ Int. J. Mol. Sci.