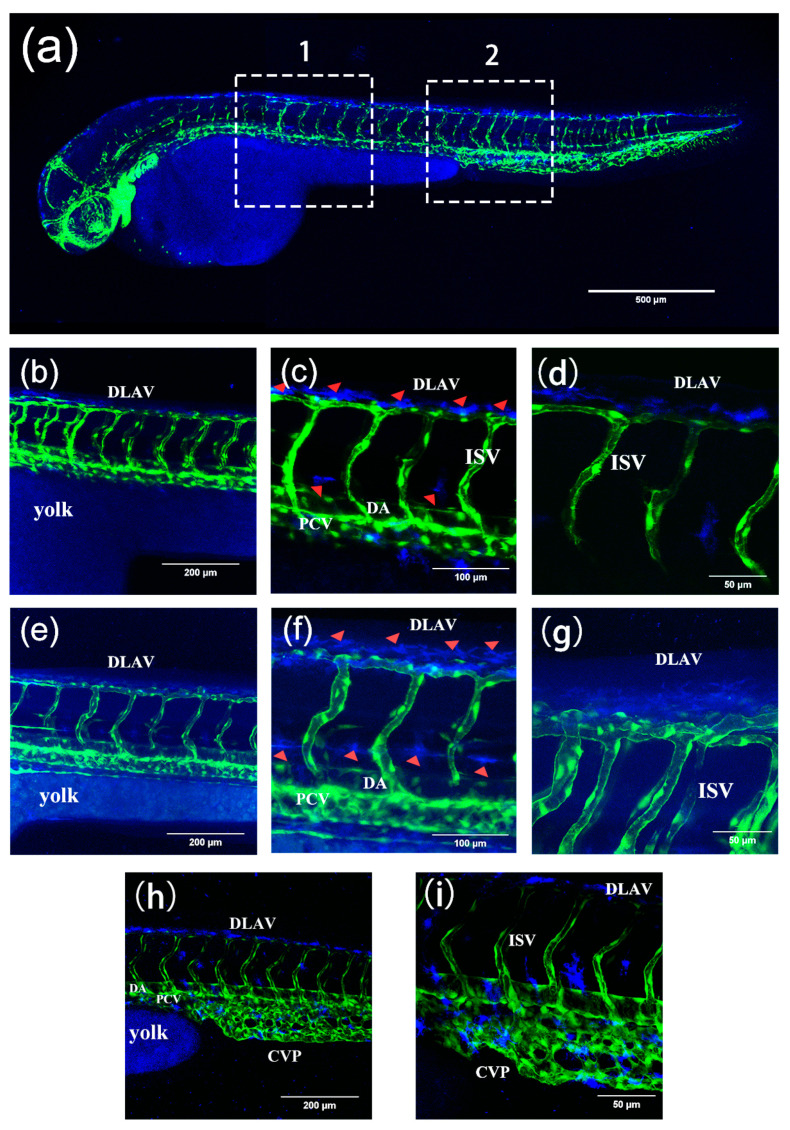
(a) The 3D images of zebrafish trunk vessels. (b–g) and (h,i) are enlarged images of areas 1 and 2 in (a), respectively. (b–d) Fluorescence images of Tg(fli1a:EGFP) after incubation with compound 2 (40 µM) for 1 h in 48 hpf larvae. In (c), most of the compounds adhere to the surface of the blood vessels, and a few enter the blood vessels. (e–g) Fluorescence images of Tg(fli1a:EGFP) after incubation with compound 2 (40 µM) for 2 h at 48 hpf. Arrowheads in (c,f) indicate that compound 2 adheres to the surface of the blood vessels. In (f), the amount of compound absorbed into the blood vessels is greatly increased. In (h,i), compound 2 enters the CVP. Zebrafish blood vessels are characterized by green fluorescence. Scale bars, 500 µm (a), 200 µm (b,e,h), 100 µm (c,f), and 50 µm (d,g,i).
Acknowledgments
This image is the copyrighted work of the attributed author or publisher, and
ZFIN has permission only to display this image to its users.
Additional permissions should be obtained from the applicable author or publisher of the image.
Full text @ Int. J. Mol. Sci.
Your Input Welcome
Thank you for submitting comments. Your input has been emailed to ZFIN curators who may contact you if
additional information is required.
Oops. Something went wrong. Please try again later.