
Image
|
Figure Caption
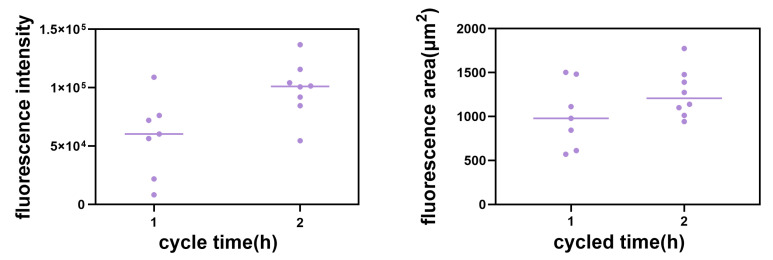
Figure 18
Fluorescence intensity of compound 2 cycled for 1 h and 2 h, respectively, and fluorescence area of compound 2 cycled for 1 h and 2 h, respectively. The number of dots in Figure 18 corresponds to the red triangles in Figure 17.
Acknowledgments
This image is the copyrighted work of the attributed author or publisher, and
ZFIN has permission only to display this image to its users.
Additional permissions should be obtained from the applicable author or publisher of the image.
Full text @ Int. J. Mol. Sci.