
FIGURE
Figure 12
- ID
- ZDB-FIG-230630-163
- Publication
- Wu et al., 2023 - AIEE-Active Flavones as a Promising Tool for the Real-Time Tracking of Uptake and Distribution in Live Zebrafish
- Other Figures
- All Figure Page
- Back to All Figure Page
Figure 12
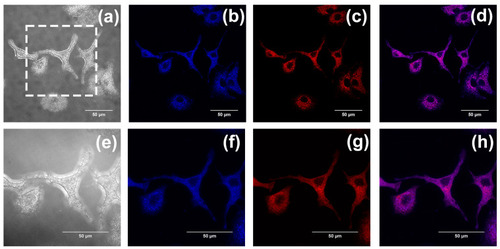
(a,e) The bright-field images of A549 cells incubated with compound 3. Co-localized images of A549 cells incubated with compound 3 (20 µM) (b,f) and Mito Tracker Red (200 nM) (c,g) for 30 min. (d,h) The merged images co-cultured with compound 3. The excitation wavelength of compound 3 was 405 nm. The excitation wavelength of Mito Tracker Red was 578 nm. (a–d) were taken using the confocal laser scanning microscope under a 60-fold lens, and (e–h) were taken under a 100-fold oil immersion lens. (e–h) are enlarged images of the dashed-square in (a). Scale bars, 50 µm. |
Expression Data
Expression Detail
Antibody Labeling
Phenotype Data
Phenotype Detail
Acknowledgments
This image is the copyrighted work of the attributed author or publisher, and
ZFIN has permission only to display this image to its users.
Additional permissions should be obtained from the applicable author or publisher of the image.
Full text @ Int. J. Mol. Sci.