
- Title
-
CCDC61/VFL3 Is a Paralog of SAS6 and Promotes Ciliary Functions
- Authors
- Ochi, T., Quarantotti, V., Lin, H., Jullien, J., Rosa E Silva, I., Boselli, F., Barnabas, D.D., Johnson, C.M., McLaughlin, S.H., Freund, S.M.V., Blackford, A.N., Kimata, Y., Goldstein, R.E., Jackson, S.P., Blundell, T.L., Dutcher, S.K., Gergely, F., van Breugel, M.
- Source
- Full text @ Structure
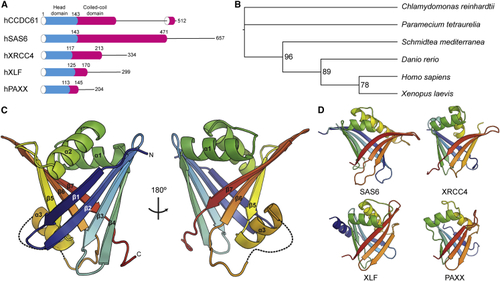
CCDC61 Is an Evolutionally Conserved Protein Paralogous to SAS6 (A) Domain architectures of the XRCC4 superfamily members. Low complexity regions are drawn by lines. (B) A phylogenetic tree of CCDC61 orthologs. Accession numbers of the corresponding amino acid sequences are provided in (C) Crystal structure of hCCDC611−143. The structure is presented using a cartoon representation and a rainbow color scheme from the N terminus (N; blue) to the C terminus (C; red). Missing loops are drawn with dotted lines. (D) Crystal structures of the XRCC4 superfamily members SAS6, XRCC4, XLF, and PAXX (PDB: See also |
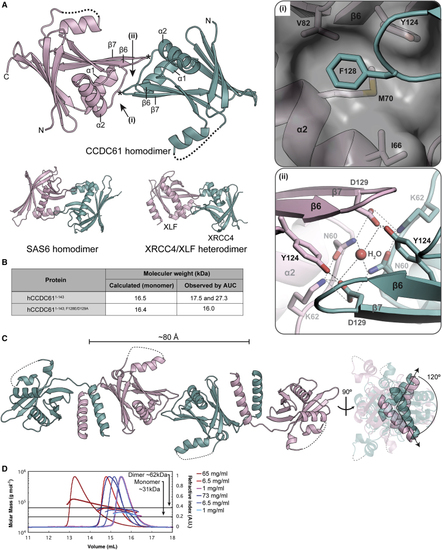
CCDC61 Forms Linear Filaments via Homodimerization Mediated by the Head and Coiled-Coil Domains (A) Crystal structure of the head-to-head homodimer of hCCDC611−143. Missing loops are drawn with dotted lines. Key residues of the interaction interface are indicated by (i) and (ii), of which magnified views are shown in the square boxes on the right. Asterisk indicates the locations of the F128 residues. Dotted lines in panel (ii) indicate hydrogen bonds. Head-to-head dimers of SAS6 and XRCC4/XLF (PDB: (B) AUC results showing that hCCDC611−143 forms homodimers in solution. (C) Crystal structure of the zCCDC611−170 tetramer. On the right, straight arrows indicate the N-to-C direction of the coiled-coil domains. The angle between the arrows is 120°. (D) CCDC61 forms higher-order oligomers in solution. Size-exclusion chromatography with multi-angle light scattering analysis of His6-lipoyl-zCCDC611−170 (red) and His6-lipoyl-zCCDC611−170; F129E/D130A (blue) using a Superdex S200 column at room temperature. Protein concentrations (before injection onto the column) were 1, 6.5, and 65 mg/ml (lightest to darkest red, respectively) and 1, 6.8, and 73 mg/ml (lightest to darkest blue, respectively). The minimum and maximum refractive index values of each chromatography profile were normalized to 0 and 1, respectively. See also |
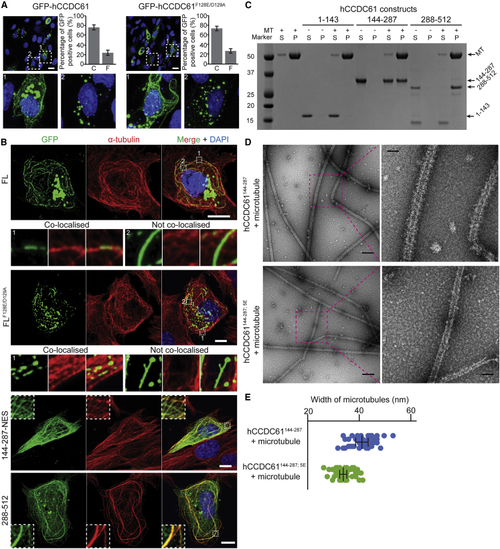
CCDC61 Binds Microtubules (A) Fluorescent images of RPE-1 cells, transiently overexpressing GFP-hCCDC61 or hCCDC61F128E/D129A, showing the different CCDC61 localization patterns observed under these conditions. Bar graphs show the percentage of GFP-positive cells containing clusters-only “C” versus filament-containing cells “F” (n = 279 for GFP-hCCDC61 and n = 468 for GFP-hCCDC61F128E/D129A counted from three biological replicates). Error bars are standard deviations. Positions of blow-up images labeled with 1 (filament-containing cell) and 2 (cluster-only cell) are indicated with white-dotted squares in the top panels. Scale bars, 20 μm. (B) Transiently overexpressed hCCDC61 colocalizes with microtubules in cells. Immunofluorescent images of RPE-1 cells transiently overexpressing GFP-hCCDC61, GFP-hCCDC61F128E/D129A, GFP-hCCDC61144−287−NES, and GFP-hCCDC61288−512. Anti-GFP staining is shown in green, microtubule staining in red. Magnified views of the regions indicated by the white-dotted squares in the merged images are shown either below (GFP-hCCDC61 and GFP-hCCDC61F128E/D129A) or as insets (GFP-hCCDC61144−287−NES and GFP-hCCDC61288−512). Displayed are representative images acquired from a total of 14, 8, 10, and 11 different RPE-1 cells for GFP-hCCDC61, GFP-hCCDC61F128E/D129A, GFP-hCCDC61144−287−NES, and GFP-hCCDC61288−512, respectively. Scale bars, 10 μm. (C) Coiled-coil and C-terminal regions of hCCDC61 bind microtubules (D) The coiled-coil domain of hCCDC61 directly binds microtubules. Negative-stain EM micrographs of microtubules that show their decoration with a layer of PAXX-hCCDC61144−287 that is not observed with the corresponding 5E mutant of CCDC61. Scale bars, 200 and 50 nm in the overview panels (left) and the magnified panels (right), respectively. (E) Quantification of the widths of microtubules decorated by PAXX-hCCDC61144−287 or in the presence of PAXX-hCCDC61144−287; 5E from (D). Widths of five different positions of ten microtubules were measured for each construct. Each point (blue for PAXX-hCCDC61144−287 and green for PAXX-hCCDC61144−287; 5E) represents a measured width at each position. Error bars (standard deviations from the mean) are shown in black lines with flat arrow ends. See also |
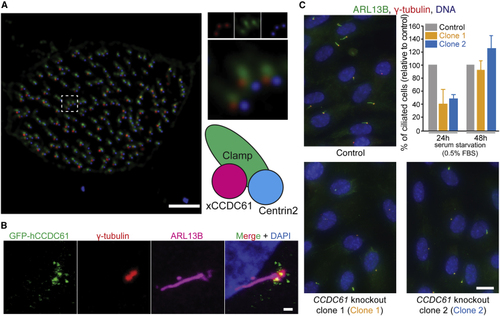
CCDC61 Associates with Basal Bodies and Plays a Role in Ciliogenesis (A) xCCDC61 associates with basal bodies and rootlets in multi-ciliated epidermal cells of (B) Location of hCCDC61 at the periphery of basal bodies of primary cilia. Immunofluorescent image of an RPE-1 cell transiently overexpressing GFP-hCCDC61. Co-immunofluorescent staining was performed against GFP (green), basal bodies (γ-tubulin, red), and the ciliary axoneme (ARL13B, magenta). Scale bar, 1 μm. (C) Ciliated cells of control and See also |
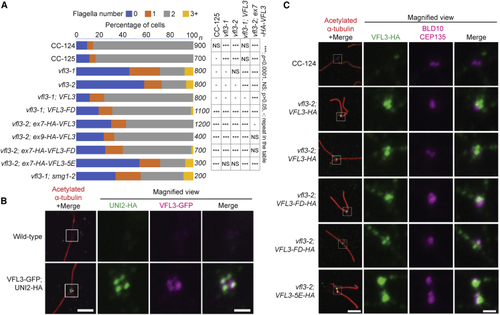
(A) Rescue of abnormal flagella numbers in (B) Wild-type VFL3 protein localizes to (C) Localization of VFL3 is affected in the 5E mutant. In the first column, cells were stained with acetylated α-tubulin (red) for cilia and rootlet microtubules, anti-HA (green) for wild-type and mutant VFL3, and anti-BLD10/CEP135 (magenta). Scale bar, 4 μm. Magnified views (4×) of the basal body regions (white boxes) are shown on the other three columns. Scale bar, 1 μm. See also |
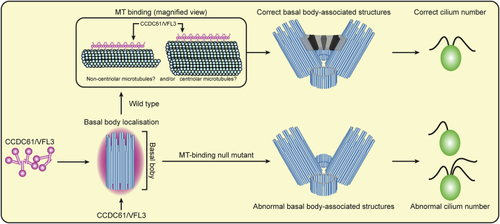
Model of the Role of CCDC61 in Ciliary Function (in CCDC61 localizes to the basal body and forms filaments that bind to centriolar and/or non-centriolar microtubules. This facilitates striated fiber formation and the correct formation of basal body-associated structures, and therefore, results in the correct cilium number. A CCDC61 mutant that does not bind microtubules (MT-binding null mutant) still localizes to the basal body region. However, the mutant is incapable of facilitating striated fiber formation, leads to incorrect formation of basal body-associated structures, and therefore causes abnormal cilium numbers. |
Reprinted from Structure (London, England : 1993), 28, Ochi, T., Quarantotti, V., Lin, H., Jullien, J., Rosa E Silva, I., Boselli, F., Barnabas, D.D., Johnson, C.M., McLaughlin, S.H., Freund, S.M.V., Blackford, A.N., Kimata, Y., Goldstein, R.E., Jackson, S.P., Blundell, T.L., Dutcher, S.K., Gergely, F., van Breugel, M., CCDC61/VFL3 Is a Paralog of SAS6 and Promotes Ciliary Functions, 674689.e11674-689.e11, Copyright (2020) with permission from Elsevier. Full text @ Structure