
Figure 3
- ID
- ZDB-FIG-230621-48
- Publication
- Ochi et al., 2020 - CCDC61/VFL3 Is a Paralog of SAS6 and Promotes Ciliary Functions
- Other Figures
- All Figure Page
- Back to All Figure Page
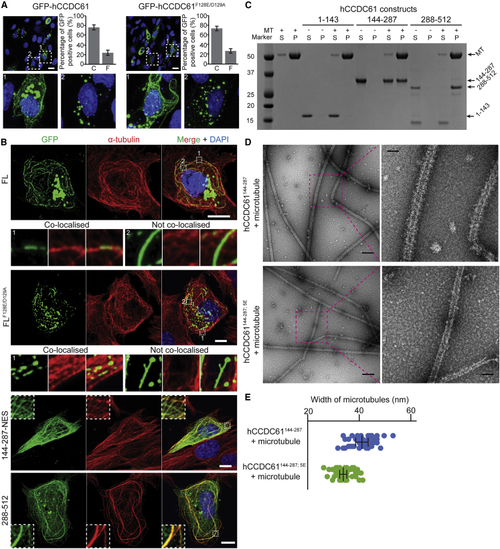
CCDC61 Binds Microtubules (A) Fluorescent images of RPE-1 cells, transiently overexpressing GFP-hCCDC61 or hCCDC61F128E/D129A, showing the different CCDC61 localization patterns observed under these conditions. Bar graphs show the percentage of GFP-positive cells containing clusters-only “C” versus filament-containing cells “F” (n = 279 for GFP-hCCDC61 and n = 468 for GFP-hCCDC61F128E/D129A counted from three biological replicates). Error bars are standard deviations. Positions of blow-up images labeled with 1 (filament-containing cell) and 2 (cluster-only cell) are indicated with white-dotted squares in the top panels. Scale bars, 20 μm. (B) Transiently overexpressed hCCDC61 colocalizes with microtubules in cells. Immunofluorescent images of RPE-1 cells transiently overexpressing GFP-hCCDC61, GFP-hCCDC61F128E/D129A, GFP-hCCDC61144−287−NES, and GFP-hCCDC61288−512. Anti-GFP staining is shown in green, microtubule staining in red. Magnified views of the regions indicated by the white-dotted squares in the merged images are shown either below (GFP-hCCDC61 and GFP-hCCDC61F128E/D129A) or as insets (GFP-hCCDC61144−287−NES and GFP-hCCDC61288−512). Displayed are representative images acquired from a total of 14, 8, 10, and 11 different RPE-1 cells for GFP-hCCDC61, GFP-hCCDC61F128E/D129A, GFP-hCCDC61144−287−NES, and GFP-hCCDC61288−512, respectively. Scale bars, 10 μm. (C) Coiled-coil and C-terminal regions of hCCDC61 bind microtubules (D) The coiled-coil domain of hCCDC61 directly binds microtubules. Negative-stain EM micrographs of microtubules that show their decoration with a layer of PAXX-hCCDC61144−287 that is not observed with the corresponding 5E mutant of CCDC61. Scale bars, 200 and 50 nm in the overview panels (left) and the magnified panels (right), respectively. (E) Quantification of the widths of microtubules decorated by PAXX-hCCDC61144−287 or in the presence of PAXX-hCCDC61144−287; 5E from (D). Widths of five different positions of ten microtubules were measured for each construct. Each point (blue for PAXX-hCCDC61144−287 and green for PAXX-hCCDC61144−287; 5E) represents a measured width at each position. Error bars (standard deviations from the mean) are shown in black lines with flat arrow ends. See also |
Reprinted from Structure (London, England : 1993), 28, Ochi, T., Quarantotti, V., Lin, H., Jullien, J., Rosa E Silva, I., Boselli, F., Barnabas, D.D., Johnson, C.M., McLaughlin, S.H., Freund, S.M.V., Blackford, A.N., Kimata, Y., Goldstein, R.E., Jackson, S.P., Blundell, T.L., Dutcher, S.K., Gergely, F., van Breugel, M., CCDC61/VFL3 Is a Paralog of SAS6 and Promotes Ciliary Functions, 674689.e11674-689.e11, Copyright (2020) with permission from Elsevier. Full text @ Structure