
- Title
-
Genetically Encoded Aminocoumarin Lysine for Optical Control of Protein-Nucleotide Interactions in Zebrafish Embryos
- Authors
- Brown, W., Wesalo, J., Samanta, S., Luo, J., Caldwell, S.E., Tsang, M., Deiters, A.
- Source
- Full text @ ACS Chem. Biol.
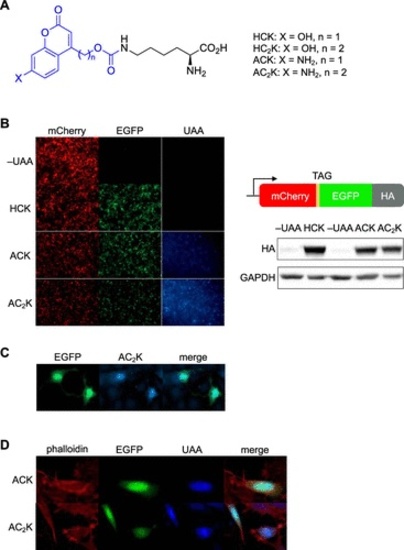
Incorporation of ACK and AC2K into proteins in mammalian cells. (A) Chemical structures of HCK, HC2K, ACK, and AC2K. The photolabile group/fluorophore is colored blue. (B) Confirmation of ACK and AC2K incorporation into a reporter construct through fluorescence imaging in HEK293T cells (10× magnification) and western blot. (C) Expression of NLS-EGFP-AC2K in live NIH 3T3 cells (20× magnification). (D) Fixed HeLa cells expressing NLS-EGFP-ACK (top row, 40×) and NLS-EGFP-AC2K (bottom row, 63×). Cells are counterstained with rhodamine–phalloidin. |
Incorporation of ACK into luciferase. (A) Structural representation of caging the fLuc active site with ACK (models generated from PDB: 4G36). Red lines indicate hydrogen bonding between K529 and luciferin–adenylate (here, a sulfate analogue as the substrate). (B) Incorporation of ACK into a dual-luciferase reporter and photoactivation of fLuc activity with 405 nm light in mammalian cells. Bars represent mean and error bars represent standard deviations of biological duplicates (no light) or triplicates (light). (C) Incorporation of ACK into a dual-luciferase reporter in zebrafish embryos is readily accomplished through injection of the mRNAs, tRNA, and UAA. (D) Luciferase incorporation and photoactivation assays. Embryos were irradiated with a 405 nm LED for the indicated amount of time. Bars represent mean, and error bars represent standard deviation from three pooled lysates of 4 embryos each. |
Photoactivation of Protein Kinase A (PKA). (A) Structural representation of the caged PKA nucleotide-binding pocket before and after light exposure. Red lines indicate hydrogen bonds (models generated from PDB: 4WB5). (B) The caPKA mutant is insulated from upstream-coupled protein receptor (GPCR) and adenylate cyclase (AC) interactions. (C) Embryos expressing PKA-ACK were irradiated at 4 hpf and imaged at 24 hpf. N = number of embryos. (D) Reverse transcription-quantitative polymerase chain reaction (RT-qPCR) measurement of the axial transcript. Bars represent mean, and error bars represent standard deviation from three independent pools of 50 embryos. An unpaired two-tailed Student’s t-test was performed between the two samples indicated. NT = nontreated embryos. |
Optical control of a RASopathy mutant of NRAS. (A) Structural representation of the caged NRAS nucleotide-binding site before and after light exposure (models generated from PDB: 5UHV). (B) Diagram of the general RAS/MAPK signaling pathway. (C) Western blot of ACK incorporation into HA-NRAS G60E K16TAG (NRAS-ACK). (D) Western blot of phospho-ERK at different timepoints after irradiation of NRAS-ACK. NT = nontreated embryos. |
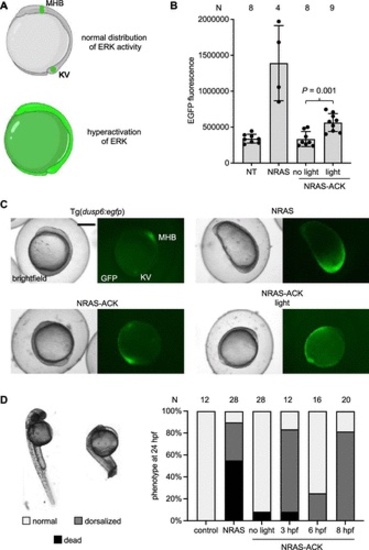
Photoactivation of a RASopathy mutant NRAS. (A) Expected distributions of EGFP in tg(dusp6:egfp) at bud stage (10 hpf). EGFP expression is indicative of ERK activity. At 10 hpf, expression is restricted to Kupffer’s vesicle (KV) and the mid-hindbrain boundary (MHB). (B) EGFP fluorescence was quantified from embryos at 10 hpf for each condition. Irradiation was performed at 6 hpf. Bars represent mean, and error bars represent standard deviation. An unpaired two-tailed Student’s t-test was performed between the two samples indicated. NT = nontreated embryos. (C) Representative images of Tg(dusp6:egfp) embryos for each condition. Scale bar = 0.5 mm. (D) Embryos were irradiated at the specified timepoint and scored for dorsalization defects at 24 hpf. Representative images are shown on the left. N = number of embryos. |
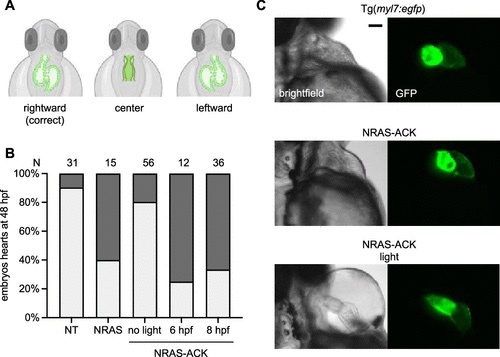
Optical control of RASopathy-induced heart defects. (A) Illustrations of examples of improper heart looping seen in zebrafish embryos. (B) Phenotypic analysis of embryo hearts at 48 hpf. N = number of embryos. NT = nontreated embryos. (C) Representative images of Tg(myl7:egfp) embryo hearts at 48 hpf. Pericardial edema is seen in the light-exposed embryos, suggesting impaired cardiac function. Scale bar = 200 μm. |