
- Title
-
Accelerated evolution analysis uncovers PKNOX2 as a key transcription factor in the mammalian cochlea
- Authors
- Trigila, A.P., Castagna, V.C., Berasain, L., Montini, D., Rubinstein, M., Gomez-Casati, M.E., Franchini, L.F.
- Source
- Full text @ Mol Bio Evol
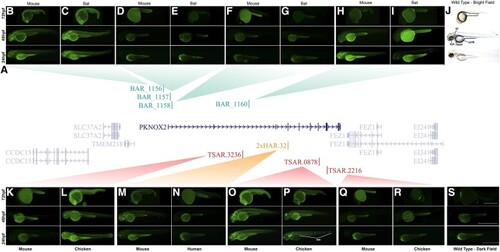
Comparative functional characterization of PKNOX2 accelerated elements using transgenic zebrafish. (A) PKNOX2 locus in chromosome 11 of the human genome showing the location of ANCEs. (B–I and K–S) Fluorescent microphotographs showing the eGFP expression pattern driven by the accelerated or conserved ortholog sequence of each PKNOX2-ANCEs. Fluorescent microphotographs of BAR1156 mouse (B) and bat (C); BAR1157 mouse (D) and bat (E); BAR1158 mouse (F) and bat (G); BAR1160 mouse (H) and bat (I); TSAR.3236 mouse (K) and chicken (L); 2xHAR.32 mouse (M) and human (N); TSAR.0878 mouse (O) and chicken (P); TSAR.2216 mouse (Q) and chicken (S) transgenic zebrafish at 24, 48, and 72 hours postfertilization (hpf). Only one representative transgenic line for each sequence is shown. All transgenic lines for each sequence are shown in supplementary figures S2–S7, Supplementary material online. Bright-field (J) and fluorescent images (S) of wild-type zebrafish are also shown. Note that the yolk sac (yolk) is autofluorescent. Scale bar: 0.5 mm. nm, neuromasts of the lateral line; oc, otic capsule. |
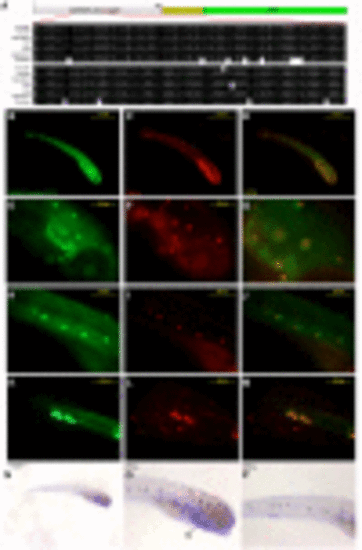
TSAR.0878-chicken expression analysis in the hearing and lateral line systems in transgenic zebrafish. (A) At the top: schematic of the transgene containing the TSAR.0878-chicken sequence cloned upstream of the cFos murine minimal promoter and the reporter gene eGFP. Below: detail of the middle part of the TSAR.0878 sequence alignment including the tested sequences (mouse and chicken) and other mammal representative sequences. (B–M) Fluorescent microphotographs of one representative transgenic zebrafish line at 7 days post fertilization (dpf) carrying the TSAR.0878-chicken transgene showing eGFP expression (B, E, H, and K), the hair cell-specific marker FM4-64 (C, F, I, and L), and the overlay (D, G, J, and M). The expression of eGFP coincides with the hair cell marker in neuromasts of the lateral line and in the otic capsule (E, G, and F) of the zebrafish. (F) shows a magnification of the otic capsule region. (N, O, and P) show PKNOX2 expression by in situ hybridization at 7 dpf. Arrows indicate the location of neuromasts of the hearing and balance systems expressing PKNOX2. Ba, branchial arches. |
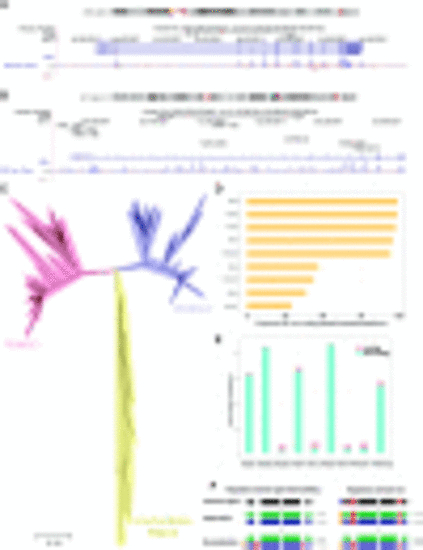
Functional diversification of PKNOX genes in vertebrates. (A) PKNOX1 locus in chromosome 21 and (B) PKNOX2 locus in chromosome 11 of the human genome (GRCh37/hg19). (C) Phylogenetic gene tree reconstruction of PKNOX proteins across vertebrate evolution, using hierarchical orthologous groups (HOGs) from the OMA Browser (https://omabrowser.org/). The evolutionary history was inferred using the neighbor-joining method. The tree is drawn to scale, with branch lengths in the same units as those of the evolutionary distances used to infer the phylogenetic tree. The evolutionary distances were computed using the JTT matrix–based method and are in the units of the number of amino acid substitutions per site. The analysis involved 218 amino acid sequences. (D) Proportion and (E) total number of coding and noncoding conserved elements (PhastCons) in TALE proteins. (F) Functional diversification hypothesis that could explain the regulatory domain gain and loss that resulted into the vertebrate PKNOX gene expression pattern. |
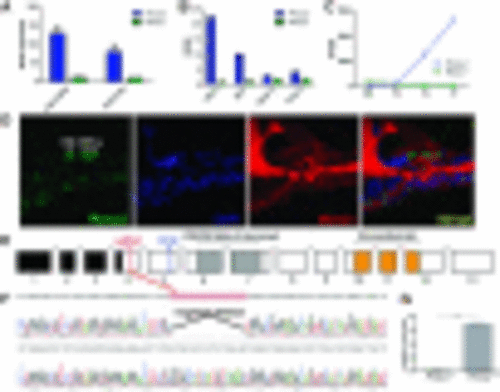
Pknox2 expression in the inner ear and gene editing strategy. (A) Graph built using microarray data from manually collected OHCs and IHCs shows Pknox2 and Pknox1 expression in adult mice (Liu et al. 2014). (B) Graph built using RNA-Seq data for four types of cochlear cells showing Pknox2 and Pknox1 expression (Liu et al. 2018). (C) Pknox2 and Pknox1 expression is depicted from RNA-Seq data for GFP+ (hair cell–enriched) cochlear samples at four stages in developing mice (Scheffer et al. 2015). (D) Photomicrographs of immunofluorescence assays showing Pknox2 and Myosin 7 a expression in the inner ear of P8 wild-type mice. (E) Schematic of the PKNOX2 gene structure and the strategy developed to generate the mutant mice pedigree lacking Pknox2. The site of priming of the RNA guide on exon 4 and the STOP codon generated in exon 5 are indicated. Black boxes indicate 5′UTR exons. (F) Chromatograms of Pknox2+/+ and Pknox2−/− loci sequencing showing the deletion induced by Cas9 in the site of priming of the sgRNA guide. (G) Western blot quantification showing strong Pknox2 expression in wild-type mouse brain samples, a tissue where Pknox2 is strongly expressed. We observed the absence of expression in Pknox2−/− mice. |
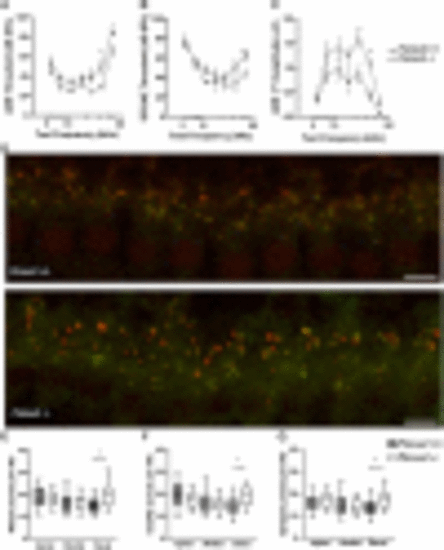
Pknox2 mutants display hearing impairment. Hearing assessment of Pknox2 mutant mice ABRs (A) and DPOAEs (B) threshold measurements in 2-month-old Pknox2+/+ and Pknox2−/− mice at different frequencies (from 5.6 to 45.25 kHz). (C) ABR peak I amplitude at 80 dB. Statistical analysis: nonparametric Mann–Whitney test; *P < 0.05, **P < 0.01, and ***P < 0.001. (D) Representative confocal images of IHC synapses from the basal turn of the cochleae immunolabeled for presynaptic ribbons (CtBP2-red) and postsynaptic receptor patches (GluA2-green) in Pknox2−/− and Pknox2+/+ mice. AntiCtBP2 antibody also weakly stains IHC nuclei. Scale bar, 7 µm. (E–G) Puncta per IHC. Quantitative data obtained from Pknox+/+ and Pknox2−/− mice. For each IHC, we analyzed the number of CtBP2 puncta (E), postsynaptic GluA2 receptor patches (F), and putative ribbon synapses (G). In Pknox2−/− mice, an increase in the number of CtBP2 puncta, GluA2 receptor patches, and synapses on the basal region is observed (Pknox2+/+n = 105 IHCs at the apical, 126 IHCs at the medial, and 139 IHCs at the basal from three animals; Pknox2−/−n = 130 IHCs at the apical, 153 IHCs at the medial, and 137 IHCs at the basal region from five animals). |

Pknox2 controls multiple key genes in the inner ear. (A) Heatmap of top upregulated and downregulated genes by P value and log2FC, grouped based on their pattern of gene expression according to the Pknox2+/+ and Pknox2−/− samples. Each row represents a gene and each column represents a sample. (B) Scheme depicting −log10(padj) values of GO terms in g:Profiler for differentially expressed genes in Pknox2+/+ and Pknox2−/−. Top terms are numbered and displayed in the table below. (C) Functional association of 57 proteins comprising the Biological Process “transmission of nerve impulse” in STRING (V11). Circle colors indicate whether the protein is upregulated (red) or downregulated (blue) in Pknox2−/− mice. |