
- Title
-
Transcriptomics and Phenotypic Analysis of gpr56 Knockout in Zebrafish
- Authors
- Sun, L., Yang, B., Peng, Z., Yang, T., Qin, B., Ao, J., Yang, Y., Wang, J., Zheng, L., Xie, H.
- Source
- Full text @ Int. J. Mol. Sci.
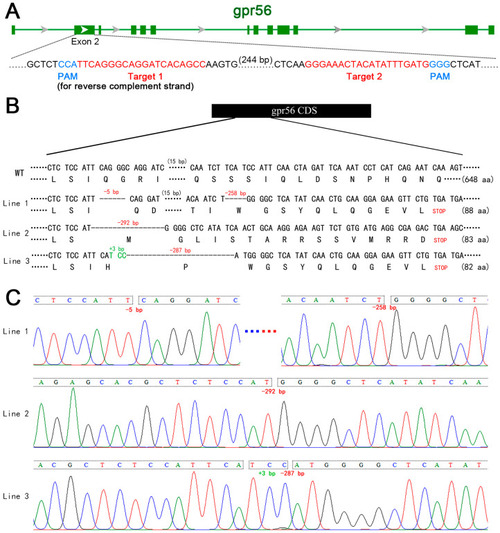
Schematic diagram of gpr56 gene knockout in zebrafish. (A) Schematic diagram of sgRNA targeting used in gpr56 gene knockout. The green horizontal line represents the genomic DNA of gpr56, the green rectangle represents the exons of gpr56, red shows the target sequence, and blue shows PAM [23]. (B) Schematic diagram of three heritable mutant alleles of gpr56 generated by gene knockout and the protein sequences encoded by them. (C) Sequencing peaks of three mutant alleles of gpr56, in which A, G, C and T are shown by green, black, blue and red curves respectively. |
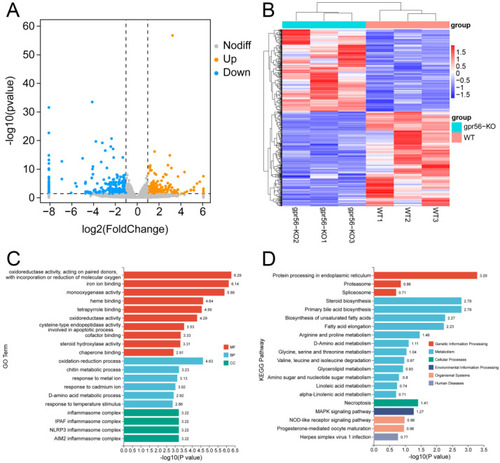
Effects of gpr56 deletion on transcriptome of 3 dpf zebrafish. (A) Volcanic map of DEGs, in which two vertical, dotted lines in the figure distinguish DEGs that differed more than twofold, whereas DEGs above the horizontal, dotted line had a p-value < 0.05. (B) Heat map of DEGs, in which one row represents a gene and each column is a sample. Red represents high-expression genes, and blue represents low-expression genes. A darker color denotes a more significant difference. (C) GO enrichment analysis of DEGs, including molecular functions (MFs), biological processes (BPs), and cellular components (CCs). (D) Enrichment analysis of KEGG pathway of DEGs. |
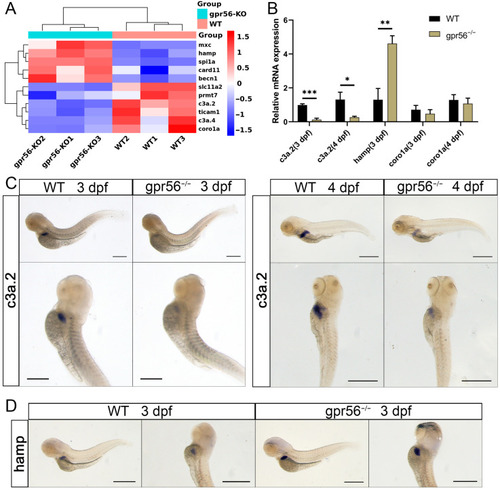
The deletion of gpr56 affects the expression of innate immunity-related genes in zebrafish juveniles. (A) Cluster analysis of the expression of genes related to innate immunity. (B) qPCR relative quantification of the mRNA level of innate immune-related genes. Values plotted are means ± SD; * p < 0.05, ** p < 0.01, *** p < 0.001 (N = 3). (C) WISH representation of c3a.2 in WT and gpr56−/− juveniles at 3 dpf and 4 dpf. (D) WISH representation of hamp in 3 dpf WT and gpr56−/− juveniles. Scale bar = 500 μm. EXPRESSION / LABELING:
PHENOTYPE:
|

The deletion of gpr56 affects the expression of pancreatic-specific genes in juvenile zebrafish. (A) Cluster analysis heatmap of pancreatic-specific expression genes. (B) qPCR detects the genes specifically expressed in pancreatic exocrine glands. Values plotted are means ± SD; * p < 0.05, ** p < 0.01 (N = 3). (C) Four WISH representative diagrams of cel.1 in 4 dpf WT and gpr56−/− zebrafish: from normal to severe defects. (D) WT 4 dpf (n = 44) and gpr56−/− (n = 35) zebrafish, consistent with the above four cel.1 expressions. (E) Representative WISH of try in 4 dpf WT and gpr56−/− zebrafish. Scale bar = 500 μm. EXPRESSION / LABELING:
PHENOTYPE:
|
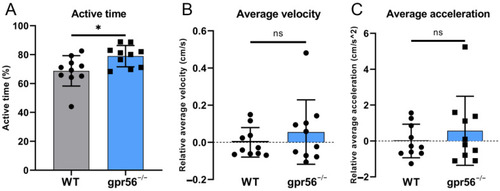
Motor ability test of 5 dpf WT and gpr56−/− zebrafish at 28 °C. (A) Activity time: the proportion of zebrafish activity time to the total test time. (B) Average speed, all data of which are zeroed to the average value of WT group. (C) Average acceleration, all data of which are zeroed to the average value of WT group. The circles record the test data and the values of the bars are their means ± SD; ns p > 0.05, * p < 0.05 (n = 10). PHENOTYPE:
|
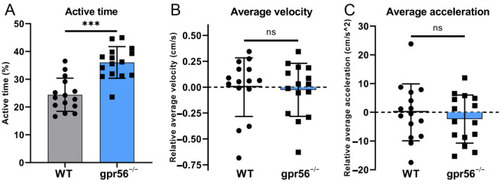
Motor ability test of 5 dpf WT and gpr56−/− zebrafish with additional tail stimulation at 23 °C. (A) Activity time: the proportion of zebrafish activity time to the total test time. (B) Average speed, all data of which are zeroed to the average value of WT group. (C) Average acceleration, all data of which are zeroed to the average value of WT group. The circles record the test data and the values of the bars are their means ± SD; ns p > 0.05, *** p < 0.001 (n = 15). PHENOTYPE:
|