
Figure 4
- ID
- ZDB-IMAGE-230515-77
- Genes
- Publication
- Sun et al., 2023 - Transcriptomics and Phenotypic Analysis of gpr56 Knockout in Zebrafish
- All Figures
- Figures for Sun et al., 2023
|
Figure 4
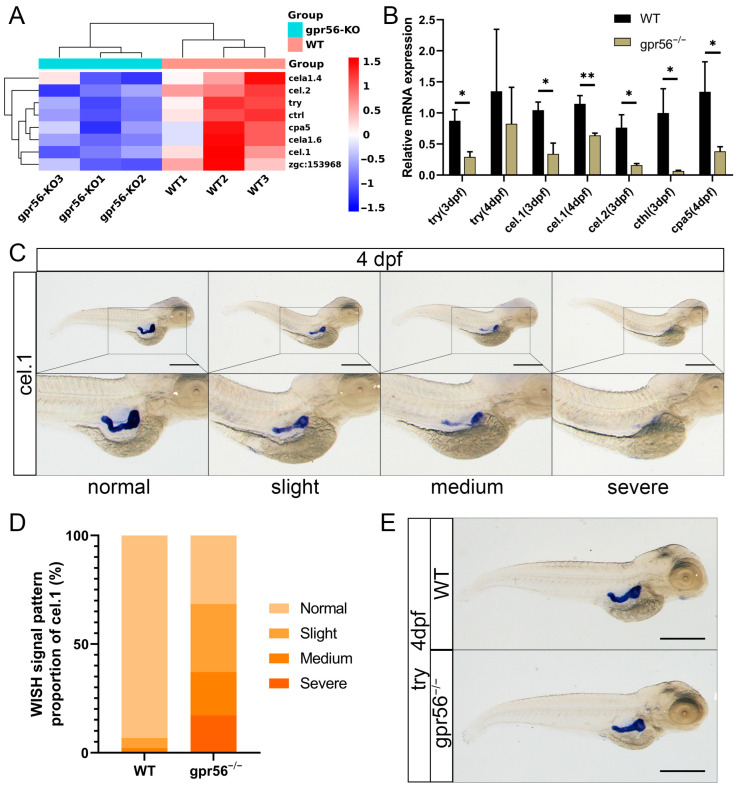
The deletion of gpr56 affects the expression of pancreatic-specific genes in juvenile zebrafish. (A) Cluster analysis heatmap of pancreatic-specific expression genes. (B) qPCR detects the genes specifically expressed in pancreatic exocrine glands. Values plotted are means ± SD; * p < 0.05, ** p < 0.01 (N = 3). (C) Four WISH representative diagrams of cel.1 in 4 dpf WT and gpr56−/− zebrafish: from normal to severe defects. (D) WT 4 dpf (n = 44) and gpr56−/− (n = 35) zebrafish, consistent with the above four cel.1 expressions. (E) Representative WISH of try in 4 dpf WT and gpr56−/− zebrafish. Scale bar = 500 μm.