
Figure 2
- ID
- ZDB-IMAGE-230515-75
- Publication
- Sun et al., 2023 - Transcriptomics and Phenotypic Analysis of gpr56 Knockout in Zebrafish
- All Figures
- Figures for Sun et al., 2023
|
Figure 2
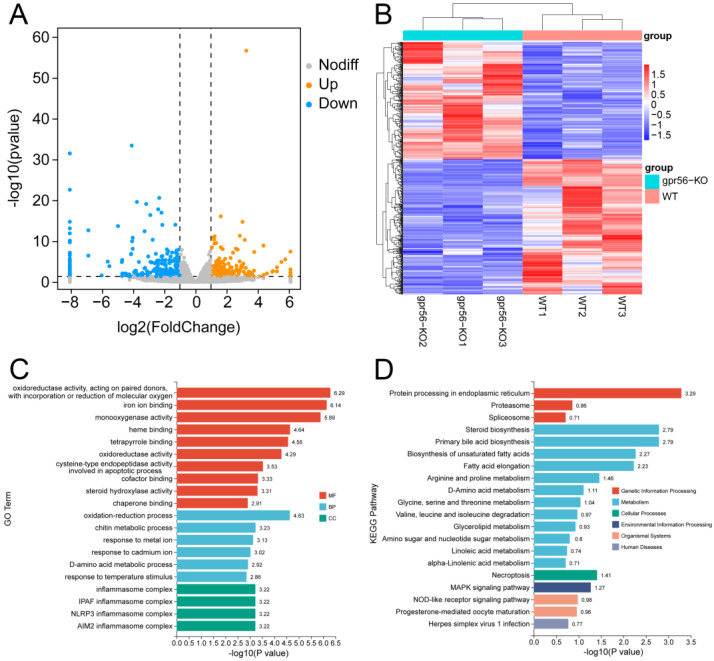
Effects of gpr56 deletion on transcriptome of 3 dpf zebrafish. (A) Volcanic map of DEGs, in which two vertical, dotted lines in the figure distinguish DEGs that differed more than twofold, whereas DEGs above the horizontal, dotted line had a p-value < 0.05. (B) Heat map of DEGs, in which one row represents a gene and each column is a sample. Red represents high-expression genes, and blue represents low-expression genes. A darker color denotes a more significant difference. (C) GO enrichment analysis of DEGs, including molecular functions (MFs), biological processes (BPs), and cellular components (CCs). (D) Enrichment analysis of KEGG pathway of DEGs.