
FIGURE
Figure 6
- ID
- ZDB-FIG-230515-78
- Publication
- Sun et al., 2023 - Transcriptomics and Phenotypic Analysis of gpr56 Knockout in Zebrafish
- Other Figures
- All Figure Page
- Back to All Figure Page
Figure 6
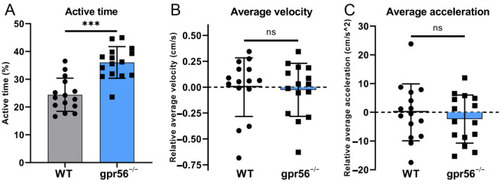
Motor ability test of 5 dpf WT and gpr56−/− zebrafish with additional tail stimulation at 23 °C. (A) Activity time: the proportion of zebrafish activity time to the total test time. (B) Average speed, all data of which are zeroed to the average value of WT group. (C) Average acceleration, all data of which are zeroed to the average value of WT group. The circles record the test data and the values of the bars are their means ± SD; ns p > 0.05, *** p < 0.001 (n = 15). |
Expression Data
Expression Detail
Antibody Labeling
Phenotype Data
| Fish: | |
|---|---|
| Condition: | |
| Observed In: | |
| Stage: | Day 5 |
Phenotype Detail
Acknowledgments
This image is the copyrighted work of the attributed author or publisher, and
ZFIN has permission only to display this image to its users.
Additional permissions should be obtained from the applicable author or publisher of the image.
Full text @ Int. J. Mol. Sci.