
FIGURE
Figure 1
- ID
- ZDB-FIG-230515-73
- Publication
- Sun et al., 2023 - Transcriptomics and Phenotypic Analysis of gpr56 Knockout in Zebrafish
- Other Figures
- All Figure Page
- Back to All Figure Page
Figure 1
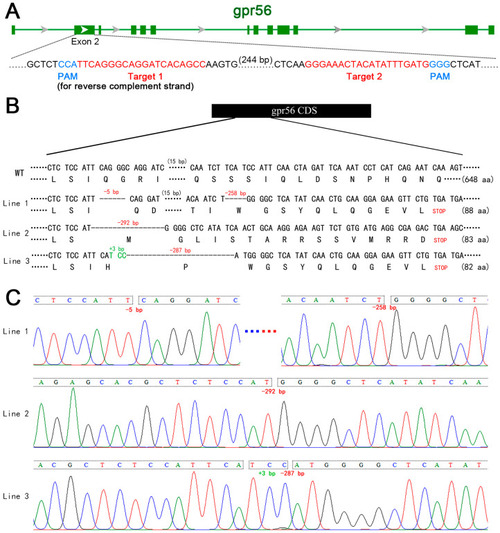
Schematic diagram of gpr56 gene knockout in zebrafish. (A) Schematic diagram of sgRNA targeting used in gpr56 gene knockout. The green horizontal line represents the genomic DNA of gpr56, the green rectangle represents the exons of gpr56, red shows the target sequence, and blue shows PAM [23]. (B) Schematic diagram of three heritable mutant alleles of gpr56 generated by gene knockout and the protein sequences encoded by them. (C) Sequencing peaks of three mutant alleles of gpr56, in which A, G, C and T are shown by green, black, blue and red curves respectively. |
Expression Data
Expression Detail
Antibody Labeling
Phenotype Data
Phenotype Detail
Acknowledgments
This image is the copyrighted work of the attributed author or publisher, and
ZFIN has permission only to display this image to its users.
Additional permissions should be obtained from the applicable author or publisher of the image.
Full text @ Int. J. Mol. Sci.