
- Title
-
Early myelination involves the dynamic and repetitive ensheathment of axons which resolves through a low and consistent stabilization rate
- Authors
- Almeida, A.R., Macklin, W.B.
- Source
- Full text @ Elife

(A) Lateral image of the spinal cord of a living Tg(mbp:eGFP-CAAX; mbp:TagRFP) larva (scale bar = 20 µm). (B) RFP+ oligodendrocyte cell counts in the dorsal and ventral regions of the spinal cord per field of view (317.4 µm long). (n=10 larvae). (C) Representative lateral images of dorsal and ventral oligodendrocytes in the spinal cord of living larvae at 4 days post fertilization (dpf) labeled by sox10:eGFP-CAAX (scale bar = 5 μm). (D) Sheath number per cell, all data combined (n=53 cells/53 larvae). (E–G) Sheath number per cell (E), average sheath length per cell (F), total sheath length per cell (G), comparing the dorsal and ventral regions (dorsal n=27 cells/27 larvae, ventral n=26 cells/26 larvae). The dashed lines in each plot represent average values with all data points shown. The error bars represent standard deviation. Significance determined by Mann-Whitney tests (see associated source data).
|
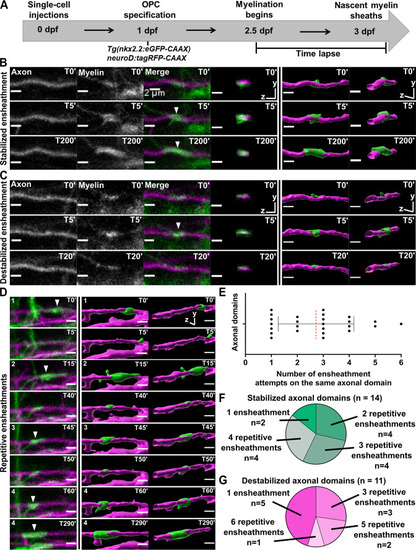
(A) Axonal ensheathment dynamics experimental paradigm. (B–C) Representative lateral images of immature ensheathments forming in the spinal cord of living Tg(nkx2.2:eGFP-CAAX) (myelin in green) larvae time-lapsed for 18 hr with a 5 min imaging interval starting at 2.5 days post fertilization (dpf). Axons were labeled with neuroD:tagRFP-CAAX (magenta). YZ images are cross sections of the axon (volume projections from Imaris). 3D reconstructions were generated in Imaris. (B) Time-lapse imaging of a stabilized ensheathment (scale bar = 2 μm). (C) Time-lapse imaging of a destabilized ensheathment (scale bar = 2 μm). (D) Representative lateral images of an axonal domain that was repetitively ensheathed four times before a sheath was stabilized. 3D reconstructions were generated in Imaris (scale bar = 2 μm). (E) Plot showing the number of times each axonal domain was ensheathed, for example, seven axonal domains had only one ensheathment attempt. Dotted red line represents the average number of ensheathment attempts. The error bar represents standard deviation (n=25 axonal domains, 18 axons, 12 larvae, 68 ensheathments imaged total). (F) Pie chart of the number of axonal domains with a final stable ensheathment and the number of ensheathment attempts that were made on each of those domains (n=14 axonal domains). (G) Pie chart of the number of destabilized axonal domains and the number of ensheathment attempts that were made on each of those domains (n=11 axonal domains) (see associated source data and supplementary video files).
|
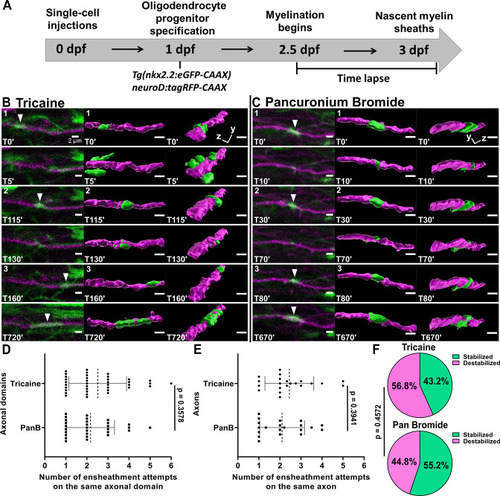
(A) Axonal ensheathment dynamics experimental paradigm. (B–C) Representative lateral images of repetitive ensheathments forming in the spinal cord of living Tg(nkx2.2:eGFP-CAAX) (myelin in green) larvae time-lapsed for 18 hr with a 5 min imaging interval starting at 2.5 days post fertilization (dpf). Axons were labeled with neuroD:tagRFP-CAAX (magenta). Scale bars = 2 µm. (B) Example from larva that was anesthetized in tricaine. (C) Example of larva that was anesthetized in pancuronium bromide. (D) Plot showing the number of times each axonal domain was ensheathed for the tricaine and pancuronium bromide groups (n=37 axonal domains for tricaine, n=29 axonal domains for pancuronium bromide). (E) The same data as in (D), but normalized by axon. When more than one domain was observed on an axon, the total number of ensheathments attempts for each domain was averaged (n=21 axons for tricaine collected from 15 larvae, n=20 axons for pancuronium bromide collected from 16 larvae). For (D) and (E), the dotted lines represent the average number of ensheathment attempts for each group. The error bars represent standard deviation. (F) Pie chart of the percent of axonal domains that were stabilized vs. destabilized. The top pie chart is for the tricaine group and the bottom pie chart is for the pancuronium bromide group. Significance was determined using non-parametric Mann-Whitney tests for (D, E). Significance was determined using a Fisher’s exact test for (F) (see associated source data and supplementary video files).
|
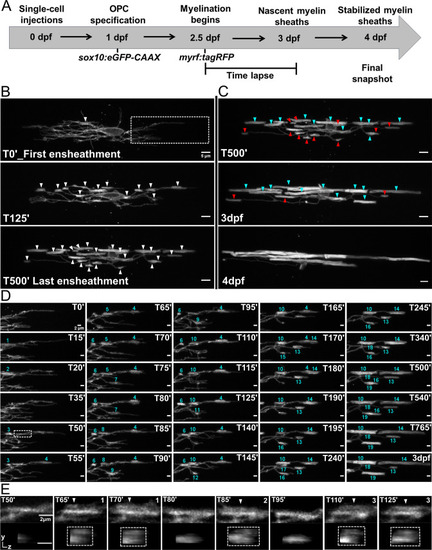
(A) Oligodendrocyte ensheathment dynamics imaging paradigm. (B–E) Lateral images of oligodendrocyte ensheathment dynamics in the spinal cord of living larvae labeled with sox10:eGFP-CAAX and time-lapsed for 15 hours with a 5-minute imaging interval from 2.5-3dpf. (B) Images show the progression of immature sheath accumulation from the first ensheathment attempt in the first panel (set at T0’) to the final ensheathment at T500’ in the bottom panel. Outlined region in first panel is analyzed further in Figure D and E. White arrows identify all immature ensheathments in each frame. (Scale bar = 5 μm). (C) Images showing sheath loss during the stabilization phase. T500’ image is presented again in the top panel and is relabeled to identify future stabilized (cyan) or destabilized (red) ensheathments. This oligodendrocyte has 22 immature sheaths at T500’, 11 of which disappeared, and it has 11 stabilized sheaths at 4dpf in the final panel (Figure 4—figure supplement 2). (Scale bar = 5 μm). (D) Images of the outlined region in the first panel of B visualizing frequent sheath initiation and loss. Each ensheathment is represented with the numbers 1-19 to signify the order that each one appears. The numbers disappear when an ensheathment is lost. Only 5 ensheathment attempts were stabilized out of a total of 19. (Scale bar = 2 μm) (E) Further enlarged images of the outlined region in Figure D (T50’). White arrows point out 3 ensheathment attempts before the final one was stabilized. The YZ images are cross sections of each ensheathment (volume projections in Imaris). A box is drawn around each cylindrical ensheathment in the YZ images. (Scale bar = 2 μm). (See associated source data and supplementary video files).
|

(A) Time required for peak (or max) sheath accumulation per cell (hours). Error bars are standard deviation. (B–F) Videos of n=19 dorsal cells (19 larvae) and n=18 ventral cells (18 larvae) were quantified for sheath initiation and loss in each 5 min frame. The time-lapse videos were then normalized for quantitative comparison by defining the video frame at which each cell accumulated its peak (or max) number of immature ensheathments as T0’. Each frame before or after that was –5 min or +5 min. The vertical dashed line aligns the T0’ time point of each graph in B, D, and F. (B) The average number of immature ensheathments for dorsal and ventral cells that are present in each frame is plotted based on time relative to T0’; error bars represent SEM. (C) Percent of ensheathment attempts from the entire imaging period that occurred prior to reaching peak. Error bars represent SEM. (D) The average number of new ensheathment attempts in each frame is plotted with the same time normalization as in B. Error bars represent SEM. (E) Similar to C, the percent of ensheathments from the entire imaging period that were lost prior to reaching peak. Error bars represent SEM. (F) The average number of ensheathments that were lost in each frame is plotted with the same time normalization as in B. Error bars represent SEM. Individual data points are shown and significance was determined by Mann-Whitney tests in A, C, and E. The data in B, D, and F was cropped at +6.5 hr (see associated source data).
|
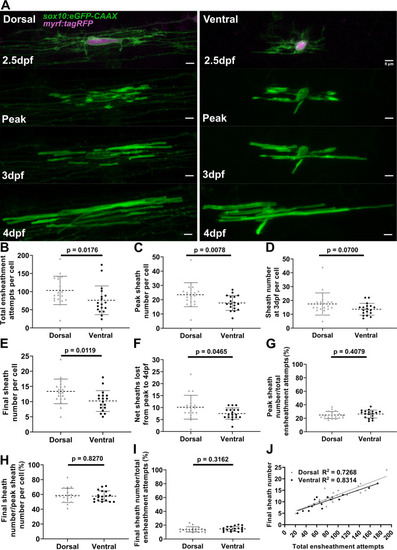
(A) Dorsal and ventral cell lateral images from the ensheathment dynamics imaging paradigm in the spinal cord of living larvae labeled with sox10:eGFP-CAAX (in green) and time-lapse imaged for 15 hr from 2.5 to 3 days post fertilization (dpf). The upper panels are a dorsal (left) and ventral (right) cell also labeled with myrf:tagRFP (magenta) at the beginning of the time-lapse experiment. The subsequent panels are the same cells at the peak of sheath accumulation, at 3 and 4 dpf (scale bar = 5 μm). (B–J) compares dorsal and ventral cells. (B) Total ensheathment attempts per cell. (C) Peak sheath number per cell. (D) Sheath number at 3 dpf per cell. (E) Final sheath number per cell at 4 dpf. (This is the same data and images as presented in Figure 4—figure supplement 1, time-lapse group.) (F) Net sheaths lost from the peak to 4 dpf. (G) Percent of sheaths stabilized during the accumulation phase (peak sheath number/total ensheathment attempts). (H) Percent of sheaths stabilized during the stabilization phase (final sheath number/peak sheath number). (I) Percent of total sheaths stabilized across both the accumulation and stabilization phases (final sheath number/total ensheathment attempts). (J) Simple linear regression comparing the total number of ensheathment attempts to the final sheath number at 4 dpf for each cell. The R2 values for each group are shown. Dorsal n=19 cells/19 larvae, ventral n=18 cells/18 larvae. The dashed lines in each plot represent average values with all data points shown. The error bars are standard deviation. Significance was determined by Mann-Whitney tests (see associated source data and supplementary video files).
|
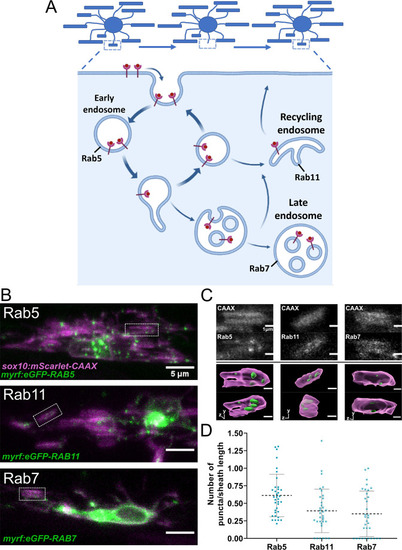
(A) The endocytic recycling pathway during sheath initiation and loss. (B) Lateral images of oligodendrocytes in the early stages of the ensheathment process in the spinal cord of living larvae at 2.5 dpf labeled with sox10:mScarlet-CAAX (magenta) and expressing either myrf:eGFP-RAB5C, myrf:eGFP-RAB7A, or myrf:eGFP-RAB11A (green). White boxes outline immature sheaths with Rab+ endosomal puncta for each fusion protein. (Scale bar = 5 μm). (C) Top panels are grey inset images from the outlined regions in B. The bottom panels are 3D reconstructions of these insets (Membrane in magenta, endosomes in green). (D) Quantification of Rab+ endosomal puncta in immature sheaths. Number of puncta in each sheath was normalized by the length of the sheath. Rab5 n = 36 sheaths (9 ventral cells/2 dorsal cells/11 larvae), Rab11 n = 34 sheaths (8 ventral cells/2 dorsal cells/10 larvae), Rab7 n = 33 sheaths (9 ventral cells/2 dorsal cells/11 larvae). Dashed lines represent average values and error bars are SD. (See associated source data and supplementary video files). © 2022, Biorender.com. Panel A adapted from “Endocytic Pathway with Macropinocytosis and Phagocytosis”, by BioRender.com (2022). Retrieved from https://app.biorender.com/biorender-templates/t9025ea05f35722d6800ab456324-endocytic-pathway-with-macropinocytosis-and-phagocytosis. It is not covered by the CC-BY 4.0 license and further reproduction of this panel would need permission from the copyright holder.
|
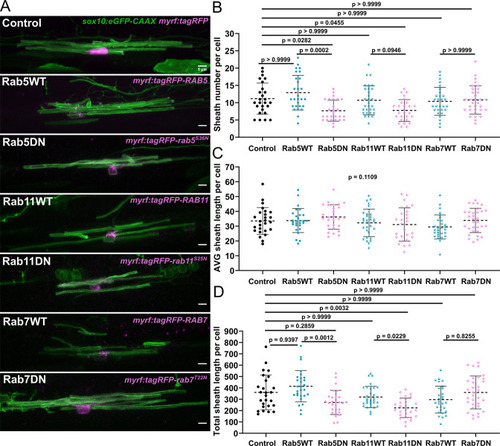
(A) Representative lateral images of ventral oligodendrocytes in the spinal cord of living larvae at 4 days post fertilization (dpf) labeled by sox10:eGFP-CAAX (green) and one of the following: myrf:tagRFP, myrf:tagRFP-RAB5C, myrf:tagRFP-rab5CS36N, myrf:tagRFP-RAB7A, myrf:tagRFP-rab7AT22N, and myrf:tagRFP-RAB11A, myrf:tagRFP-rab11AS25N (all in magenta). The image and data for the control is the same as for the ventral group in Figure 1 (scale bar = 5 μm). (B) Sheath number per cell. (C) Average sheath length per cell. (D) Total sheath length per cell (myrf:tagRFP n=26 cells/26 larvae, myrf:tagRFP-RAB5C n=28 cells/28 larvae, myrf:tagRFP-rab5CS36N n=27 cells/27 larvae, myrf:tagRFP-RAB7A n=29 cells/29 larvae, myrf:tagRFP-rab7AT22N n=32 cells/32 larvae, and myrf:tagRFP-RAB11A n=30 cells/30 larvae, myrf:tagRFP-rab11AS25N n=27 cells/27 larvae). The dashed lines in each plot represent average values with all data points shown. Error bars are standard deviation. Global significance was determined using a Kruskal-Wallis test for B–D. This global p-value is shown for C since it was not significant. Post hoc multiple comparison tests were not performed for this analysis. Post hoc Dunn’s multiple comparison tests were performed to compare groups in B and D. We compared everything with the control group and compared each wild-type and associated mutant with each other. The different Rab groups were not compared with each other (see associated source data).
|
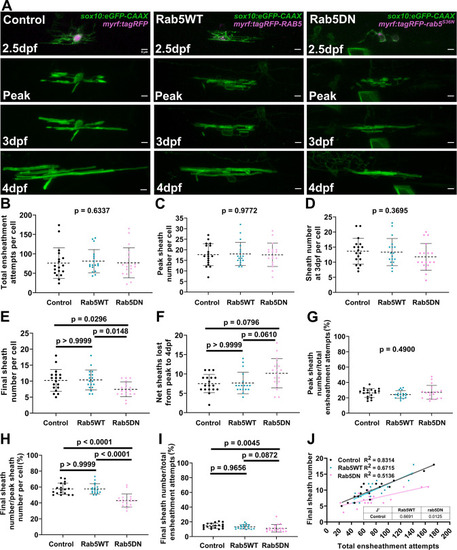
(A) Lateral images from the ventral spinal cord of living larvae labeled with sox10:eGFP-CAAX (in green) and one of the following: myrf:tagRFP, myrf:tagRFP-RAB5C, myrf:tagRFP-rab5CS36N (all in magenta); and time-lapsed for 15 hours from 2.5-3dpf. The first panel is an image taken immediately before starting the time-lapse experiment. The subsequent panels are the same cells at the peak of sheath accumulation, at 3dpf, and at 4dpf. The images and data for the control are the same as for the ventral group in Figure 6. (Scale bar = 5 μm). (B) Total ensheathment attempts per cell. (C) Peak sheath number per cell. (D) Sheath number at 3dpf per cell. (E) Final sheath number per cell at 4dpf. (F) Net sheaths lost from the peak to 4dpf. (G) Percent of sheaths stabilized during the accumulation phase (peak sheath number/total ensheathment attempts). (H) Percent of sheaths stabilized during the stabilization phase (final sheath number/peak sheath number). (I) Percent of total sheaths stabilized across both the accumulation and stabilization phases (final sheath number/total ensheathment attempts). (J) Simple linear regression comparing the total number of ensheathment attempts to the final sheath number at 4dpf for each cell. (control n=18 cells/18 larvae, wild-type Rab5 n=18 cells/18 larvae, Rab5DN n=18 cells/17 larvae). The dashed lines in each plot represent average values with all data points shown. The error bars are standard deviation. Significance was determined using global Kruskal-Wallis tests. These p-values are shown for B-D and G since they were not significant. Post hoc multiple comparisons tests were not performed for these analyses. Post hoc Dunn’s multiple comparisons tests were done for E, F, H, and I and the individual p-values are shown. (J’) The slopes of the Rab5WT and Rab5DN regression lines from J were compared to the control in Graphpad by (two-tailed) testing the null hypothesis that the slopes are identical (the lines are parallel). P-values are shown in the table. (See associated source data and supplementary video files).
|

(A) A model depicting how the repetitive ensheathment of axons is occurring during the dynamic accumulation phase of the sheath formation process. Oligodendrocytes are green, axons are pink, and the nascent ensheathments are purple. (B) A model depicting that Rab5WT helps to promote the stabilization of nascent sheaths during the stabilization phase of the sheath formation process (left). The Rab5DN mutant instead results in fewer stabilized sheaths (right). Oligodendrocytes are green, axons are pink, nascent ensheathments are purple, and stabilized ensheathments are also green.
|