
|
Figure 1
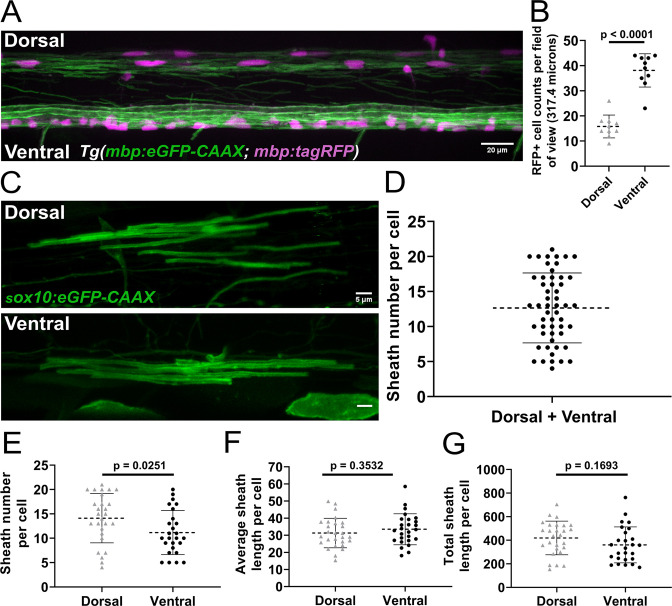
(A) Lateral image of the spinal cord of a living Tg(mbp:eGFP-CAAX; mbp:TagRFP) larva (scale bar = 20 µm). (B) RFP+ oligodendrocyte cell counts in the dorsal and ventral regions of the spinal cord per field of view (317.4 µm long). (n=10 larvae). (C) Representative lateral images of dorsal and ventral oligodendrocytes in the spinal cord of living larvae at 4 days post fertilization (dpf) labeled by sox10:eGFP-CAAX (scale bar = 5 μm). (D) Sheath number per cell, all data combined (n=53 cells/53 larvae). (E–G) Sheath number per cell (E), average sheath length per cell (F), total sheath length per cell (G), comparing the dorsal and ventral regions (dorsal n=27 cells/27 larvae, ventral n=26 cells/26 larvae). The dashed lines in each plot represent average values with all data points shown. The error bars represent standard deviation. Significance determined by Mann-Whitney tests (see associated source data).
Sheath number was highly variable, but oligodendrocytes in the dorsal region of the spinal cord had more sheaths per cell than oligodendrocytes in the ventral region.