
Figure 6
- ID
- ZDB-FIG-230522-46
- Publication
- Almeida et al., 2023 - Early myelination involves the dynamic and repetitive ensheathment of axons which resolves through a low and consistent stabilization rate
- Other Figures
- All Figure Page
- Back to All Figure Page
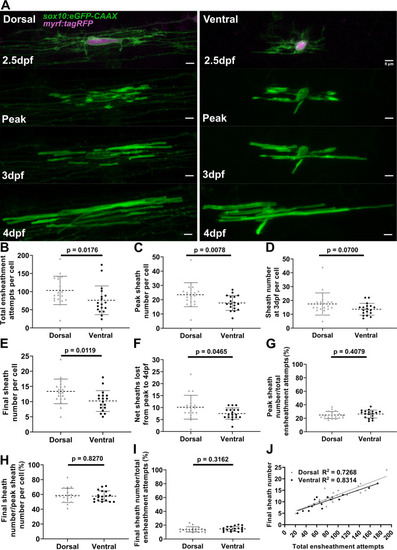
(A) Dorsal and ventral cell lateral images from the ensheathment dynamics imaging paradigm in the spinal cord of living larvae labeled with sox10:eGFP-CAAX (in green) and time-lapse imaged for 15 hr from 2.5 to 3 days post fertilization (dpf). The upper panels are a dorsal (left) and ventral (right) cell also labeled with myrf:tagRFP (magenta) at the beginning of the time-lapse experiment. The subsequent panels are the same cells at the peak of sheath accumulation, at 3 and 4 dpf (scale bar = 5 μm). (B–J) compares dorsal and ventral cells. (B) Total ensheathment attempts per cell. (C) Peak sheath number per cell. (D) Sheath number at 3 dpf per cell. (E) Final sheath number per cell at 4 dpf. (This is the same data and images as presented in Figure 4—figure supplement 1, time-lapse group.) (F) Net sheaths lost from the peak to 4 dpf. (G) Percent of sheaths stabilized during the accumulation phase (peak sheath number/total ensheathment attempts). (H) Percent of sheaths stabilized during the stabilization phase (final sheath number/peak sheath number). (I) Percent of total sheaths stabilized across both the accumulation and stabilization phases (final sheath number/total ensheathment attempts). (J) Simple linear regression comparing the total number of ensheathment attempts to the final sheath number at 4 dpf for each cell. The R2 values for each group are shown. Dorsal n=19 cells/19 larvae, ventral n=18 cells/18 larvae. The dashed lines in each plot represent average values with all data points shown. The error bars are standard deviation. Significance was determined by Mann-Whitney tests (see associated source data and supplementary video files).
|