
|
Figure 2
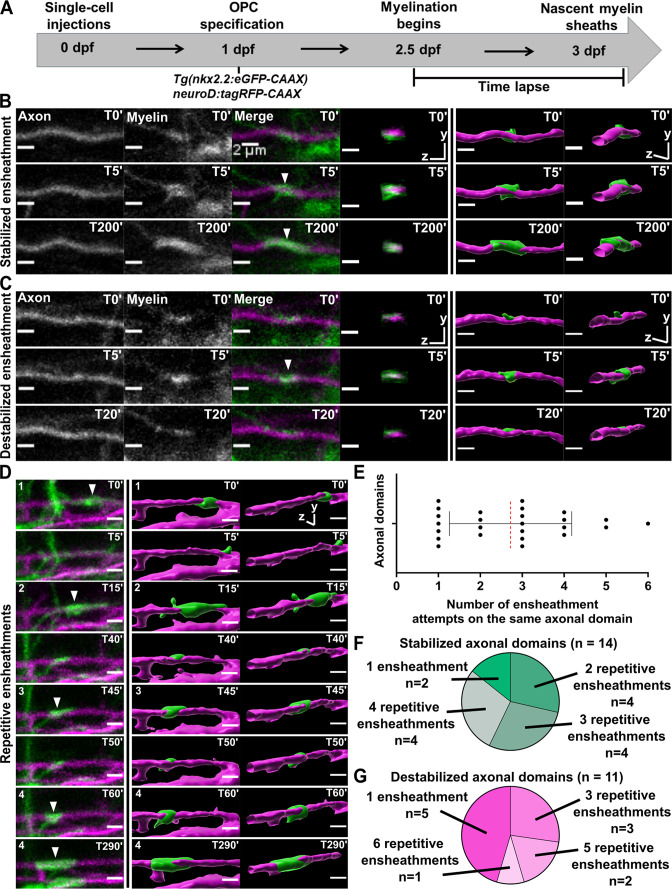
(A) Axonal ensheathment dynamics experimental paradigm. (B–C) Representative lateral images of immature ensheathments forming in the spinal cord of living Tg(nkx2.2:eGFP-CAAX) (myelin in green) larvae time-lapsed for 18 hr with a 5 min imaging interval starting at 2.5 days post fertilization (dpf). Axons were labeled with neuroD:tagRFP-CAAX (magenta). YZ images are cross sections of the axon (volume projections from Imaris). 3D reconstructions were generated in Imaris. (B) Time-lapse imaging of a stabilized ensheathment (scale bar = 2 μm). (C) Time-lapse imaging of a destabilized ensheathment (scale bar = 2 μm). (D) Representative lateral images of an axonal domain that was repetitively ensheathed four times before a sheath was stabilized. 3D reconstructions were generated in Imaris (scale bar = 2 μm). (E) Plot showing the number of times each axonal domain was ensheathed, for example, seven axonal domains had only one ensheathment attempt. Dotted red line represents the average number of ensheathment attempts. The error bar represents standard deviation (n=25 axonal domains, 18 axons, 12 larvae, 68 ensheathments imaged total). (F) Pie chart of the number of axonal domains with a final stable ensheathment and the number of ensheathment attempts that were made on each of those domains (n=14 axonal domains). (G) Pie chart of the number of destabilized axonal domains and the number of ensheathment attempts that were made on each of those domains (n=11 axonal domains) (see associated source data and supplementary video files).
Oligodendrocytes repetitively ensheathed the same axonal domains before stable sheaths were formed.