
- Title
-
Antisense, but not sense, repeat expanded RNAs activate PKR/eIF2α-dependent ISR in C9ORF72 FTD/ALS
- Authors
- Parameswaran, J., Zhang, N., Braems, E., Tilahun, K., Pant, D.C., Yin, K., Asress, S., Heeren, K., Banerjee, A., Davis, E., Schwartz, S.L., Conn, G.L., Bassell, G.J., Van Den Bosch, L., Jiang, J.
- Source
- Full text @ Elife
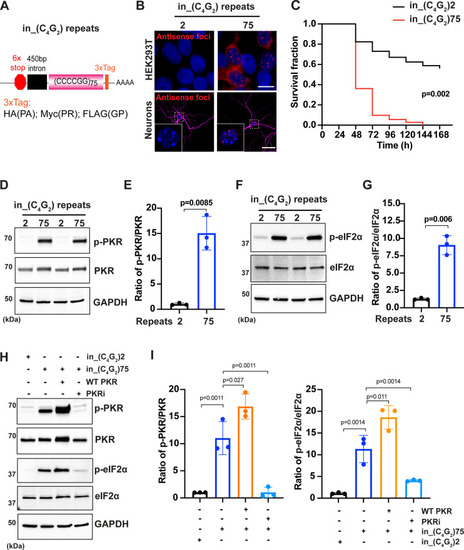
(A) Schematic illustration of the in_(C4G2)75 repeat construct including 6× stop codons, 450 bp of human intronic sequences at the N-terminus and 3× protein tags at the C- terminus of the repeats to monitor the DPR proteins in each frame. (B) Representative images of antisense RNA foci in HEK293T cells and in primary cortical neurons expressing in_(C4G2)75 detected by RNA FISH. Red, foci; blue, DAPI; magenta, MAP2. (C) Kaplan–Meier curves showing increased risk of cell death in in_(C4G2)75-expressing primary cortical neurons compared with neurons expressing 2 repeats. Statistical analyses were performed using Mantel–Cox test (replicated three times with similar results). (D, E) Immunoblotting analysis of phosphorylated PKR (p-PKR) and total PKR in HEK293T cells expressing in_(C4G2)75 or 2 repeats. p-PKR levels were detected using anti-p-PKR (T446) and normalized to total PKR. GAPDH was used as a loading control. Error bars represent SD (n = 3 independent experiments). Statistical analyses were performed using Student’s t-test. (F, G) Immunoblotting analysis of phosphorylated eIF2α (p-eIF2α) and total eIF2α in HEK293T cells expressing in_(C4G2)75 or 2 repeats. p-eIF2α levels were detected using anti-phosphor eIF2α (Ser51) and normalized to total eIF2α. GAPDH was used as a loading control. Error bars represent SD (n = 3 independent experiments). Statistical analyses were performed using Student’s t-test. (H, I) Immunoblotting analysis of p-PKR and p-eIF2α in HEK293T cells expressing in_(C4G2)75, with or without co-expression of wild type PKR, or treatment of a PKR inhibitor, C16. Error bars represent SD (n = 3 independent experiments). Statistical analyses were performed using one-way ANOVA with Tukey’s post hoc test. Scale bars: 10 µm (neurons), 20 µm (HEK293T).
|
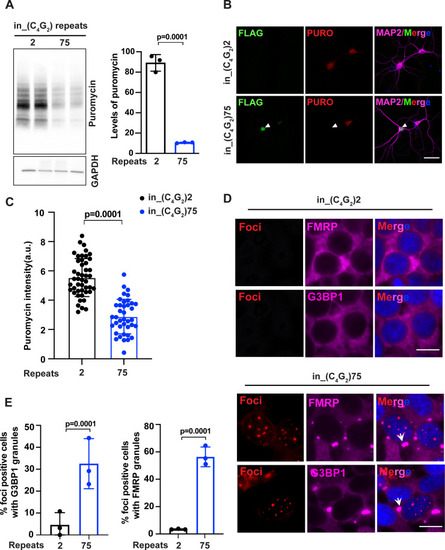
(A) Immunoblotting of puromycin in HEK293T cells expressing in_(C4G2)75 or 2 repeats. Cells were incubated with puromycin for 30 min before harvesting. The level of puromycin was normalized to GAPDH. Error bars represent SD (n = 3 independent experiments). Statistical analyses were performed using Student’s t-test (B) Representative images and (C) quantification of primary neurons expressing either (C4G2)75 or 2 repeats stained with anti-puromycin (red), anti-FLAG (green), DAPI (blue), and MAP2 (magenta). The puromycin intensity was quantified using ImageJ. Error bars represent SD (n = 40–50 neurons/group; similar results were obtained from two independent experiments). Statistical analyses were performed using Student’s t-test. (D) Representative images of G3BP1 and FMRP staining in HEK293T cells expressing in_(C4G2)75 and in_(C4G2)2 repeats. (E) Quantification of antisense foci-positive cells with G3BP1 and FMRP granules. Error bars represent SD (n = 150 cells/condition and three independent experiments). Statistical analyses were performed using Student’s t-test. Scale bars, 10 µm (neurons), 20 µm (HEK293T).
|
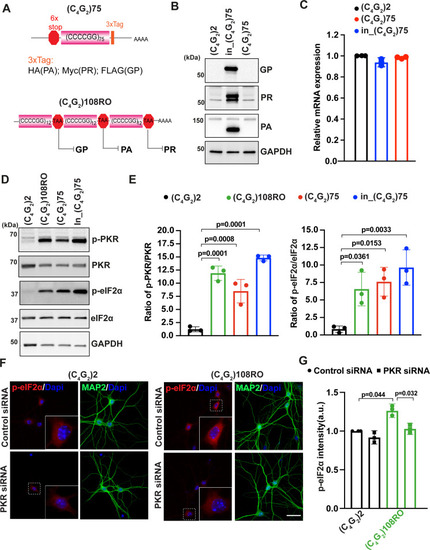
(A) (Top) Schematic illustration of (C4G2)75 repeats without the human intronic sequences. 3× protein tags were included at the C- terminus of the repeats to monitor the DPR proteins in each frame. (Bottom) Schematic illustration of antisense (C4G2)108RO repeats with stop codons inserted in every 12 repeats to prevent the translation of DPR proteins from all reading frames. (B) Immunoblotting of DPR proteins in HEK293T cells expressing in_(C4G2)75, (C4G2)75, or 2 repeats. DPR protein levels were detected using anti-FLAG (frame with GP), anti-MYC (frame with PR), and anti-HA (frame with PA). GAPDH was used as a loading control. (C) mRNA levels were measured by quantitative qPCR in cell expressing in_(C4G2)75, (C4G2)75, or 2 repeats. Error bars represent SD (n = 3). (D, E) Immunoblotting of p-PKR and p-eIF2α in HEK293T cells expressing in_(C4G2)75, (C4G2)75, (C4G2)108RO, or 2 repeats. p-PKR (T446) and p-eIF2α (Ser51) were normalized to total PKR and eIF2α, respectively. GAPDH was used as a loading control. Error bars represent SD (n = 3 independent experiments). Statistical analyses were performed using one-way ANOVA with Tukey’s post hoc test. (F, G) Representative images (F) and quantitation (G) of p-eIF2α in primary neurons expressing antisense (C4G2)108RO or 2 repeats in the presence and absence of PKR siRNA. Scale bars, 10 µm.
|
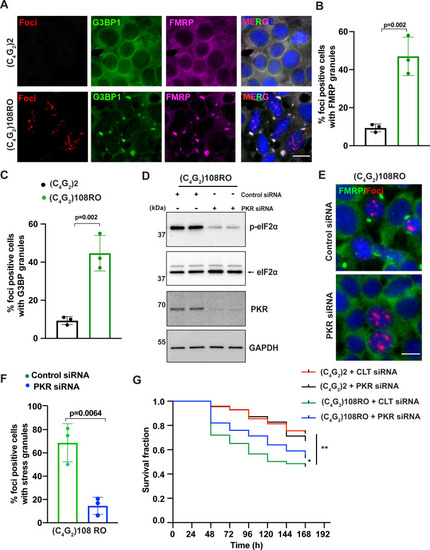
(A) Representative images of FMRP and G3BP1 staining in HEK293T cells expressing (C4G2)108RO or 2 repeats. (B, C) Quantification of antisense foci-positive cells with FMRP and G3BP1 granules. Error bars represent SD (n = 180 cells/condition and three independent experiments). Statistical analyses were performed using Student’s t-test. (D) Immunoblotting of PKR and p-eIF2α (Ser51) in HEK293T cells expressing (C4G2)108RO together with control or PKR siRNA. GAPDH was used as a loading control. (E) Representative images of FMRP staining in HEK293T cells expressing (C4G2)108 repeats together with either control or PKR siRNA. (F) Quantification of antisense foci-positive cells with FMRP granules. Error bars represent SD (n = 150 cells/condition and three independent experiments). (F) Kaplan–Meier curves showing the risk of cell death in (C4G2)108RO-expressing neurons compared with 2 repeats in the presence and absence of PKR siRNA (replicated three times with similar results). Statistical analyses were performed using Mantel–Cox test (*p<0.05, **p<0.01). Scale bars, 20 µm.
|
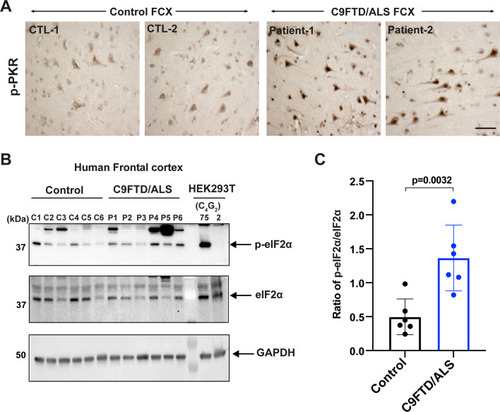
(A) Representative immunohistochemistry images of phosphorylated PKR staining in control and C9FTD/ALS patient’s frontal cortex (FCX) using anti-p-PKR (T446) (n = 4 per genotype). (B, C) Immunoblotting of p-eIF2α in proteins extracted from control (C1–C6) and C9FTD/ALS patient’s frontal cortex (P1–P6). p-eIF2α (Ser51) was normalized to total eIF2α. GAPDH was used as a loading control. Error bars represent SD (control n = 6 and C9FTD/ALS n = 6). Statistical analyses were performed using unpaired Student’s t-test. Scale bars, 10 µm.
|

(A) Immunoblotting of p-PKR and p-eIF2α in HEK293T cells expressing (G4C2)75 or (G4C2)2 repeats. (B) Representative images of sense and antisense RNA foci in HEK293T expressing (G4C2)75 repeats together with either control antisense oligonucleotides (ASOs), ASOs targeting sense G4C2RNAs or ASOs targeting antisense C4G2 repeat expanded RNAs. Foci were detected by RNA FISH. Red, foci; blue, DAPI. (C) Immunoblotting and (D) quantification of p-PKR and p-eIF2α in HEK293T cells expressing (G4C2)75 or (G4C2)2 repeats together with either control ASO or ASOs targeting sense G4C2 repeat expanded RNAs. Phosphorylated PKR levels were detected using anti-p-PKR (phosphor T446) and normalized to total PKR. Phosphorylated eIF2α levels were detected using anti-peIF2α (Ser51) and normalized to total eIF2α. GAPDH was used as a loading control. Error bars represent SD (n = 3 independent experiments). Statistical analyses were performed using unpaired Student’s t-test. (E, F) Immunoblotting of p-PKR and p-eIF2α in HEK293T cells expressing (G4C2)75 or (G4C2)2 repeats together with either control ASO or ASOs targeting antisense G4C2 repeat expanded RNAs. P-PKR (T446) and p-eIF2α (Ser51) were normalized to total PKR and eIF2α, respectively. GAPDH was used as a loading control. Error bars represent SD (n = 3 independent experiments). Statistical analyses were performed using one-way ANOVA with Tukey’s post hoc test. (G) Representative images and (H) quantification of FMRP and G3BP1 staining in HEK293T cells expressing (G4C2)75 or (G4C2)2 repeats in the presence and absence of antisense ASO2. Error bars represent SD (n = 150 cells/condition and three independent experiments). Statistical analyses were performed using one-way ANOVA with Tukey’s post hoc test. Scale bars, 20 µm.
|
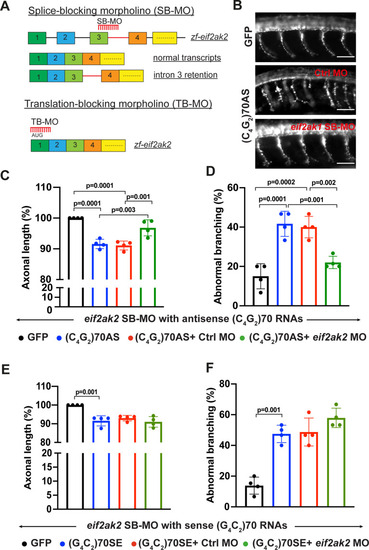
(A) Schematic illustration of splice-blocking morpholino (SB-MO) targeting the exon 3/intron 3 junction in zebrafish eif2ak2 pre-mRNA. The correctly spliced (wild type transcripts) and intron 3 retained transcripts are shown. The translation-blocking morpholino targets the AUG start codon in post-spliced eif2ak2 mRNA. (B) SV2 immunostaining of motor axons in 30 hpf zebrafish embryos injected with GFP control mRNA and antisense (C4G2)70 RNAs. Scale bar = 50 µm. (C, D) Effects of SB-MO on axonal length (C) and branching (D) of zebrafish expressing antisense (C4G2)70 RNAs. Embryos were injected with 0.844 µM GFP mRNA, 0.844 µM antisense (C4G2)70 RNAs, 0.844 µM antisense (C4G2)70 RNAs plus 0.25 mM control morpholino, or 0.844 µM antisense (C4G2)70 RNAs plus 0.25 mM eif2ak2 morpholino. Error bars represent SD (n = 4 independent experiments). Statistical analyses were performed using one-way ANOVA with Tukey’s post hoc test. (E, F) Effects of SB-MO on axonal length and branching of zebrafish expressing sense (G4C2)70 RNAs. Embryos were injected with 0.844 µM GFP mRNA, 0.844 µc sense (G4C2)70 RNAs, 0.844 µM sense (G4C2)70 RNAs plus 0.25 mM control morpholino or 0.844 µM sense (G4C2)70 RNAs plus 0.25 mM eif2ak2 morpholino. Error bars represent SD (n = 4 independent experiments). Statistical analyses were performed using one-way ANOVA with Tukey’s post hoc test.
|
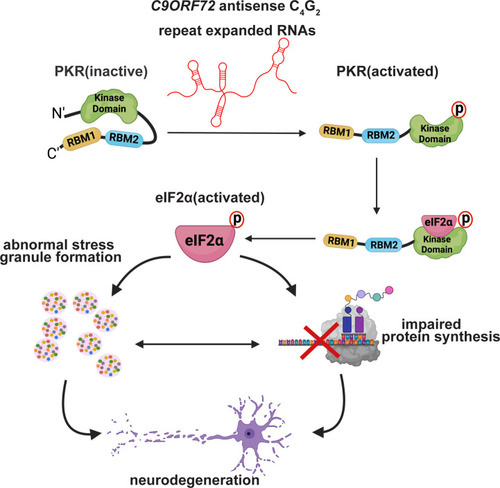
C9ORF72 antisense C4G2 repeat expanded RNAs activate PKR/eIF2α-dependent integrated stress response and lead to neurotoxicity independent of DPR proteins. |