
|
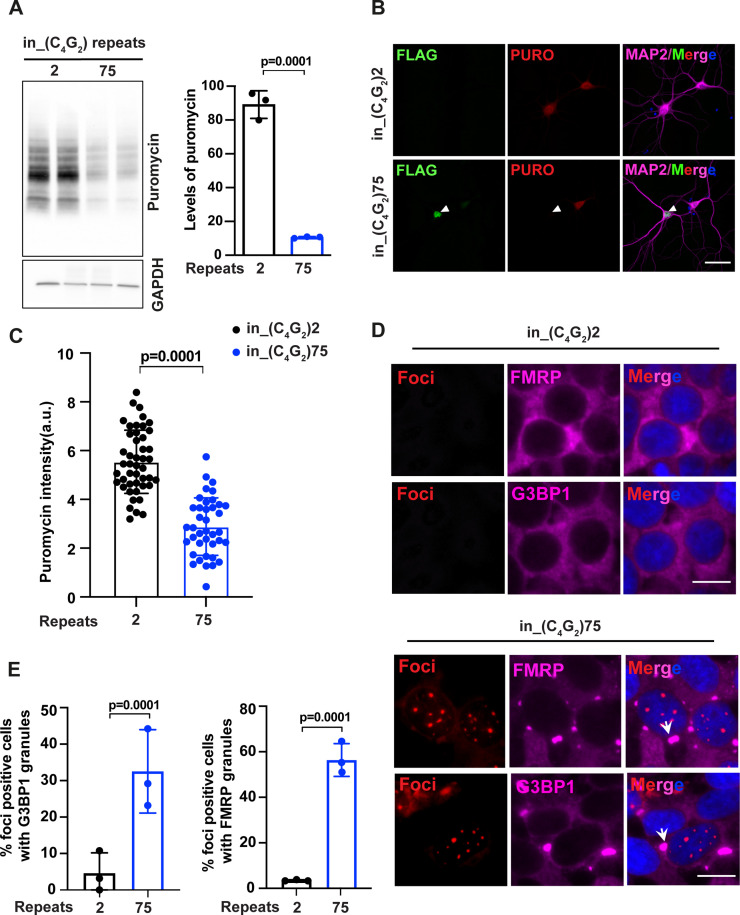
Figure 2
(A) Immunoblotting of puromycin in HEK293T cells expressing in_(C4G2)75 or 2 repeats. Cells were incubated with puromycin for 30 min before harvesting. The level of puromycin was normalized to GAPDH. Error bars represent SD (n = 3 independent experiments). Statistical analyses were performed using Student’s t-test (B) Representative images and (C) quantification of primary neurons expressing either (C4G2)75 or 2 repeats stained with anti-puromycin (red), anti-FLAG (green), DAPI (blue), and MAP2 (magenta). The puromycin intensity was quantified using ImageJ. Error bars represent SD (n = 40–50 neurons/group; similar results were obtained from two independent experiments). Statistical analyses were performed using Student’s t-test. (D) Representative images of G3BP1 and FMRP staining in HEK293T cells expressing in_(C4G2)75 and in_(C4G2)2 repeats. (E) Quantification of antisense foci-positive cells with G3BP1 and FMRP granules. Error bars represent SD (n = 150 cells/condition and three independent experiments). Statistical analyses were performed using Student’s t-test. Scale bars, 10 µm (neurons), 20 µm (HEK293T).
C9ORF72 antisense C4G2 expanded repeats inhibit global protein synthesis and induce stress granule assembly.