
|
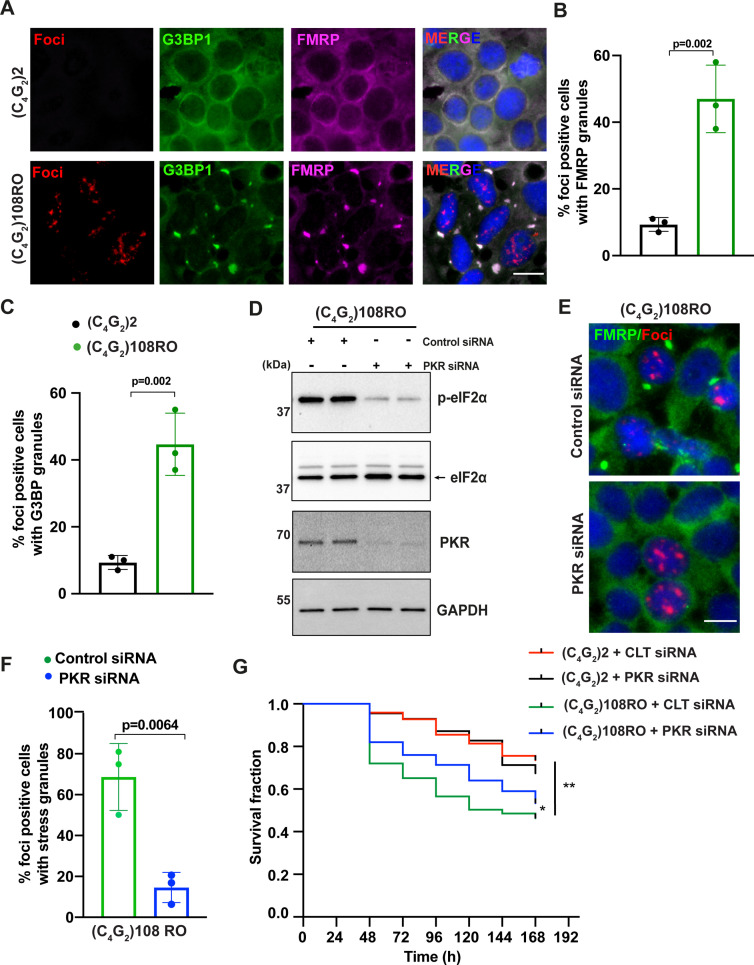
Figure 4
(A) Representative images of FMRP and G3BP1 staining in HEK293T cells expressing (C4G2)108RO or 2 repeats. (B, C) Quantification of antisense foci-positive cells with FMRP and G3BP1 granules. Error bars represent SD (n = 180 cells/condition and three independent experiments). Statistical analyses were performed using Student’s t-test. (D) Immunoblotting of PKR and p-eIF2α (Ser51) in HEK293T cells expressing (C4G2)108RO together with control or PKR siRNA. GAPDH was used as a loading control. (E) Representative images of FMRP staining in HEK293T cells expressing (C4G2)108 repeats together with either control or PKR siRNA. (F) Quantification of antisense foci-positive cells with FMRP granules. Error bars represent SD (n = 150 cells/condition and three independent experiments). (F) Kaplan–Meier curves showing the risk of cell death in (C4G2)108RO-expressing neurons compared with 2 repeats in the presence and absence of PKR siRNA (replicated three times with similar results). Statistical analyses were performed using Mantel–Cox test (*p<0.05, **p<0.01). Scale bars, 20 µm.
Antisense C4G2 repeat expanded RNAs themselves induce stress granules and lead to neuronal toxicity.