
|
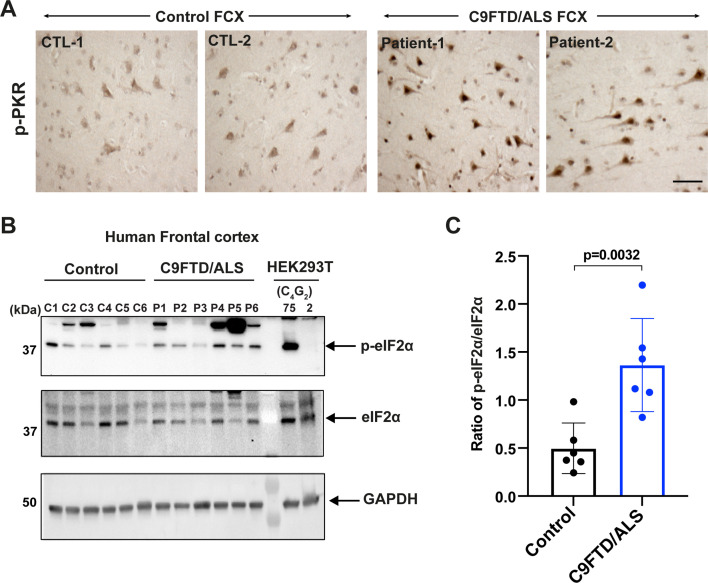
Figure 5
(A) Representative immunohistochemistry images of phosphorylated PKR staining in control and C9FTD/ALS patient’s frontal cortex (FCX) using anti-p-PKR (T446) (n = 4 per genotype). (B, C) Immunoblotting of p-eIF2α in proteins extracted from control (C1–C6) and C9FTD/ALS patient’s frontal cortex (P1–P6). p-eIF2α (Ser51) was normalized to total eIF2α. GAPDH was used as a loading control. Error bars represent SD (control n = 6 and C9FTD/ALS n = 6). Statistical analyses were performed using unpaired Student’s t-test. Scale bars, 10 µm.
Increased levels of phosphorylated PKR and eIF2α in C9FTD/ALS patients.