
Figure 1
- ID
- ZDB-FIG-230518-109
- Publication
- Parameswaran et al., 2023 - Antisense, but not sense, repeat expanded RNAs activate PKR/eIF2α-dependent ISR in C9ORF72 FTD/ALS
- Other Figures
- All Figure Page
- Back to All Figure Page
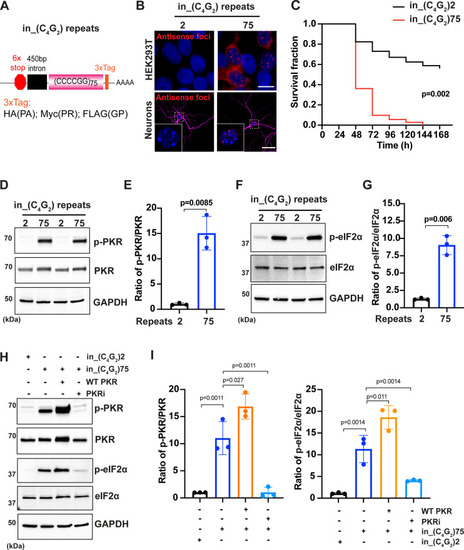
(A) Schematic illustration of the in_(C4G2)75 repeat construct including 6× stop codons, 450 bp of human intronic sequences at the N-terminus and 3× protein tags at the C- terminus of the repeats to monitor the DPR proteins in each frame. (B) Representative images of antisense RNA foci in HEK293T cells and in primary cortical neurons expressing in_(C4G2)75 detected by RNA FISH. Red, foci; blue, DAPI; magenta, MAP2. (C) Kaplan–Meier curves showing increased risk of cell death in in_(C4G2)75-expressing primary cortical neurons compared with neurons expressing 2 repeats. Statistical analyses were performed using Mantel–Cox test (replicated three times with similar results). (D, E) Immunoblotting analysis of phosphorylated PKR (p-PKR) and total PKR in HEK293T cells expressing in_(C4G2)75 or 2 repeats. p-PKR levels were detected using anti-p-PKR (T446) and normalized to total PKR. GAPDH was used as a loading control. Error bars represent SD (n = 3 independent experiments). Statistical analyses were performed using Student’s t-test. (F, G) Immunoblotting analysis of phosphorylated eIF2α (p-eIF2α) and total eIF2α in HEK293T cells expressing in_(C4G2)75 or 2 repeats. p-eIF2α levels were detected using anti-phosphor eIF2α (Ser51) and normalized to total eIF2α. GAPDH was used as a loading control. Error bars represent SD (n = 3 independent experiments). Statistical analyses were performed using Student’s t-test. (H, I) Immunoblotting analysis of p-PKR and p-eIF2α in HEK293T cells expressing in_(C4G2)75, with or without co-expression of wild type PKR, or treatment of a PKR inhibitor, C16. Error bars represent SD (n = 3 independent experiments). Statistical analyses were performed using one-way ANOVA with Tukey’s post hoc test. Scale bars: 10 µm (neurons), 20 µm (HEK293T).
|