
- Title
-
Identification of unique α4 chain structure and conserved anti-angiogenic activity of α3NC1 type IV collagen in zebrafish
- Authors
- LeBleu, V.S., Dai, J., Tsutakawa, S., MacDonald, B.A., Alge, J.L., Sund, M., Xie, L., Sugimoto, H., Tainer, J., Zon, L.I., Kalluri, R.
- Source
- Full text @ Dev. Dyn.
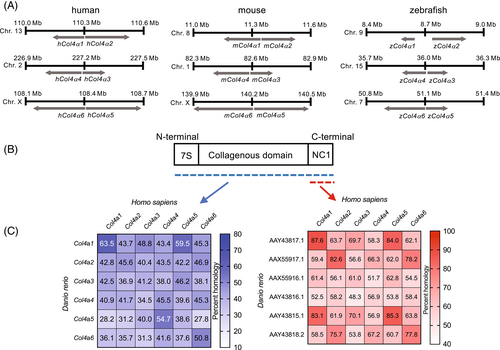
Chromosome mapping for α chains between human, mouse, and zebrafish and amino acid sequence homology. (A) Chromosome mapping of human, mouse, and zebrafish collagen IV α chains. (B) Schematic representation of the domains of Collagen IV chains and (C) homology of amino acids in full length collagen IV (blue) or NC1 domains (red). |
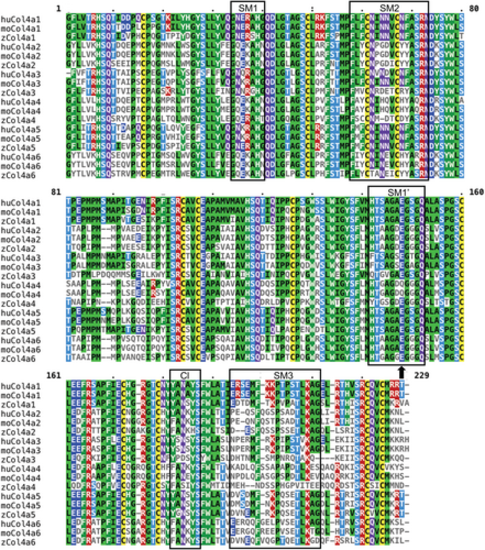
Sequence comparison of the human, mouse, and zebrafish NC1 domain. Comparison of amino acid sequence shows conservation among different species. Subdomains of interests are boxed, structural motifs, SM1 (hairpin β3–β4), SM2 (hairpin β6–β7), SM1’ (hairpin β3’–β4’), SM3 (β9 and preceding loop), and CI (chloride ion). Arrow points to amino acid residue similar in zCol4a4 and hCol4a1 and hCol4a2 NC1 domain. hu, human; mo, mouse; z, zebrafish. |
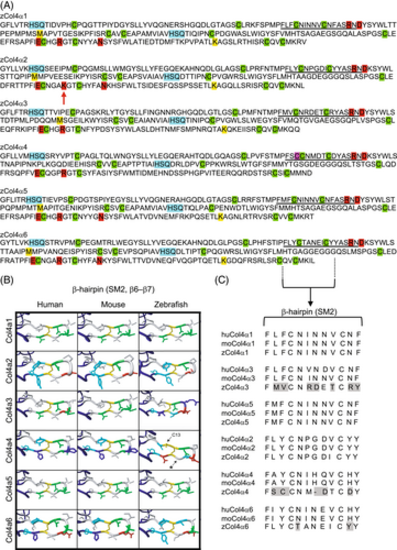
Structure of the NC1 domain of zebrafish collagen IV α-chain proteins. (A) Sequence comparison of the zebrafish α1-α6 NC1 domains. Cyan: HSQ tripeptide that begin each NC1 subdomain. Green: 12 conserved cysteine residues. Magenta: additional cysteine (Cysteine 13, Cys-13) in zCol4α4. Red: residues involved in salt bridges formed between the R76 D78, E175-R179, and N187. The red arrow points to the R179K substitution in zCol4α2. Yellow: M93 and K211 residues involved in the peroxidasin-catalyzed sulfilimine bond formation. (B) Representation of the 3D molecular remodeling of human, mouse and zebrafish NC1 domain β-hairpin SM2 subdomain. The additional cysteine (C13) in NC1 β-hairpin of zCol4α4 is indicated by the arrow. The asterisk points to the area where the zebrafish protein backbone is shorter than the human and mouse homologues. (C) Amino acid sequence alignment for human, mouse, and zebrafish NC1 domain, highlighting key residues in the SM2 (hairpin β6–β7) subdomain that indicates less conservation between the α3, α4, and α6 chains compared to the α1, α2, and α5 chains. |
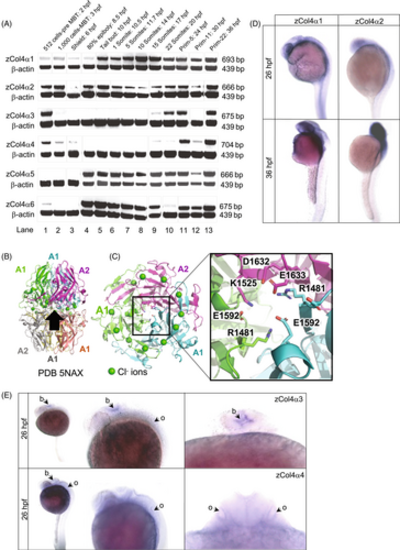
Embryonic expression of the six collagen IV α chains in zebrafish. (A) RT-PCR products for the zebrafish type IV collagen α chains at the indicated developmental stages (top band) range in size from 666 to 704 bp. The β-actin control band is shown below. Three expression patterns are noted: developmentally unrestricted (α1 and α2 chains); postgastrulation (α5 and α6 chains); and late-onset expression (α3 and α4 chains). Expression before 6 h postfertilization (hpf) stage is maternal. (B) Cartoon schematic of NC1 heterohexamer of α1 and α2 NC1 chains (PDB 5NAX). Black arrow shows viewpoint for C. (C) Bottom-up view of the heterotrimer. The inset is a close-up view of salt bridges that help form the heterotrimer interface. In the α1 and α2 chains, a glutamate (E1592 in α1 and E1633 in α2) forms a salt bridge with a basic residue (R1481 in α1 and K1525 in α2). (D) In situ hybridization for zebrafish α1 and α2 chains at 26 hpf and 36 hpf. (E) In situ hybridization for zebrafish α3 and α4 chains at 26 hpf, dorsal and lateral views. The α3 and α4 chain are localized in the developing brain (b), with α4 chain also detected in the otic vesicle (o). hpf, hours postfertilization, MBT, mid-blastula transition. |

Tissue distribution of the six collagen IV α chains in zebrafish development. (A) In situ hybridization for zebrafish α6 chains at 36 hpf in the brain (b), otic vesicle (o), gills (g), developing cardiac tissue (c), and the pronephric duct (pn) of the future kidney. (B) RT-PCR products in adult zebrafish for the six α chains are shown above the positive control β-actin. All six α chains are detectable in brain, gills, kidney, skeletal muscle, swim bladder, and testes. Gut/bowel and skin express the α1, α2, α5, and α6 chains only. Liver and heart both display expression of all α chains except the α3 chain. EXPRESSION / LABELING:
|
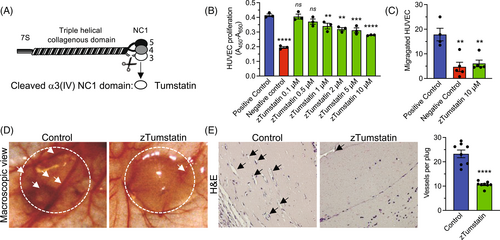
Recombinant zTumstain, the NC1 domain of the α3 chain of type IV collagen, shows conserved antiangiogenic activity on human endothelial cells. (A) Schematic depiction of Col4 α3α4α5 protomer and cleavage site releasing Tumstatin (α3 NC1 domain). (B) Relative HUVECs proliferation when treated with the indicated concentration of eukaryotically produced zTumstatin, n = 3 wells per condition. Positive control: 10% FBS, Negative control: 0.1% FBS. (C) HUVECs migration in a Boyden-chamber assay, n = 4–6 wells per condition. (D) Representative macroscopic image of control and zTumstatin Matrigel plug (encircled) and blood vessels (arrows). (E) Representative H&E section of control and zTumstatin Matrigel plug (black arrows point to blood vessels) and quantification of averaged blood vessels per 200× field per plug, n = 8 plugs per group (two plug per mouse and four mice per group). (B,C) One-way ANOVA, (E) unpaired two-tailed t test, ns: not significant, **p < 0.01, ***p < 0.001, and ****p < 0.0001. |