
- Title
-
Susceptibility and Permissivity of Zebrafish (Danio rerio) Larvae to Cypriniviruses
- Authors
- Streiff, C., He, B., Morvan, L., Zhang, H., Delrez, N., Fourrier, M., Manfroid, I., Suárez, N.M., Betoulle, S., Davison, A.J., Donohoe, O., Vanderplasschen, A.
- Source
- Full text @ Viruses
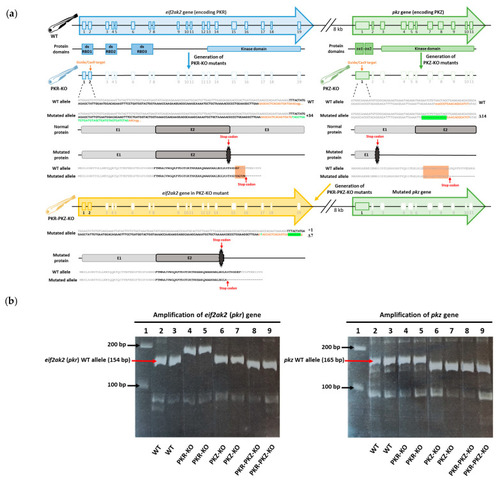
Generation and verification of CRISPR-Cas9 eif2ak2 (pkr) and pkz mutations in zebrafish (a) Structure of zebrafish eif2ak2 (pkr) and pkz genes and proteins. The protein domains including double stranded RNA-binding domains (dsRB), Z-DNA/RNA binding domains (zα) and kinase domains are aligned to the corresponding exons. The CRISPR/Cas9 gene editing targets were exon 2 in zebrafish eif2ak2 gene and exon 1 in zebrafish pkz gene; sgRNA target sequences are also displayed (orange, PAM lower case). The CRISPR/Cas9-induced changes in the WT eif2ak2 gene (34-base insertion) to generate PKR-KO, and WT pkz gene (14-base deletion) to generate the PKZ-KO mutant strains are displayed. After the generation of the PKZ-KO mutant strain, the WT eif2ak2 gene in this strain was also mutated, resulting in the PKR-PKZ-KO mutant strain (displayed below). The mutated eif2ak2 gene in the PKR-PKZ-KO strain exhibits a different mutation (7-base deletion with 1-base insertion) relative to the mutated eif2ak2 gene in PKR-KO mutant. Inserted and deleted sequences are highlighted in green (deleted sequences are represented by “-“). ( |
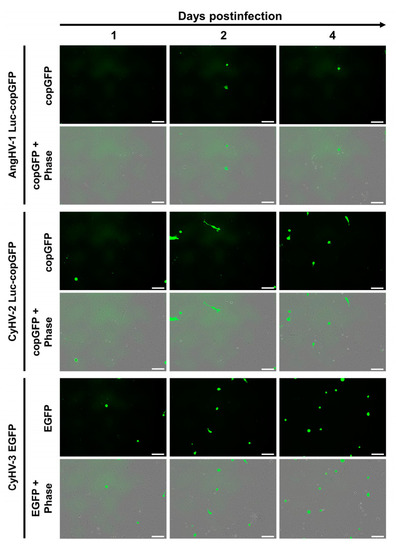
Infection of ZF4 cells by cypriniviruses. ZF4 cells were infected with the AngHV-1 Luc-copGFP, CyHV-2 Luc-copGFP and CyHV-3 EGFP recombinant strains. Infection progression was imaged by epifluorescence microscopy. Infected cells were identified based on green fluorescence expression at the indicated timepoints of infection. Scale bars = 100 µm. |
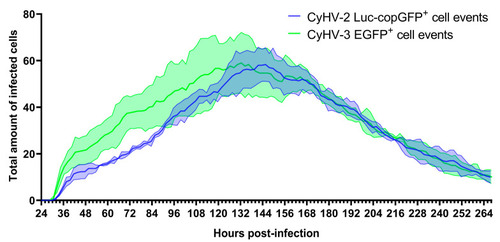
Quantification of CyHV-2 and CyHV-3-infected cells in ZF4 monolayer over time. This data was acquired via time-lapse fluorescent microscopy (IncuCyte). Cells were cultured in a 24-well plate and infected with CyHV-2 Luc-copGFP or CyHV-3 EGFP recombinants (1.2 × 10⁶ PFU/mL for each recombinant). At 24 hpi, cells were imaged every 2 h for 11 days. Data represent the mean ± standard errors from three replicates/wells. Data from each replicate at each timepoint represent the sum of fluorescent cells observed in nine separate locations of each well. |
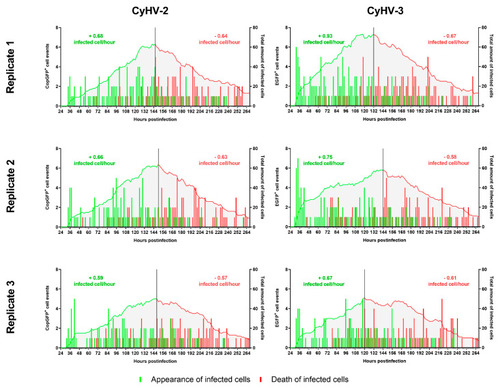
Kinetics of appearance and death of CyHV-2 and CyHV-3-infected cells before and after infection peak. The bars relate to the temporal pattern of appearance and disappearance of CyHV-2-infected or CyHV-3-infected cells (based on fluorescent reporter expression). The quantities are based on the total amount of observations made in 9 different locations in each well/replicate. The green and red curves show the total amount of infected cells up until the peak of infection (represented by the black vertical line) and after the peak, respectively. The values on top of the curves represent the average rate of appearance of infected cells per hour (green) and the average rate of death per hour (red). Analysing the rate of appearance/hour before the peak for CyHV-2 and CyHV-3 revealed no differences between the viruses. |
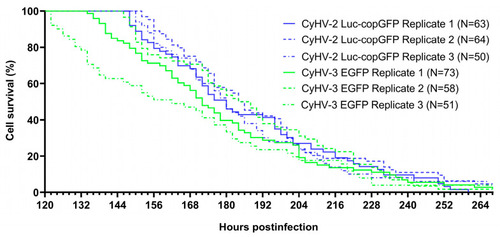
Survival kinetics for CyHV-2 and CyHV-3-infected cells displayed as Kaplan-Meier plots. CyHV-2 and CyHV-3-infected cells observed at 120 hpi were monitored until the end of the experiment. Cell death events and times were identified based on the disappearance of fluorescent signals (Figure S2). N = Number of cells followed. |
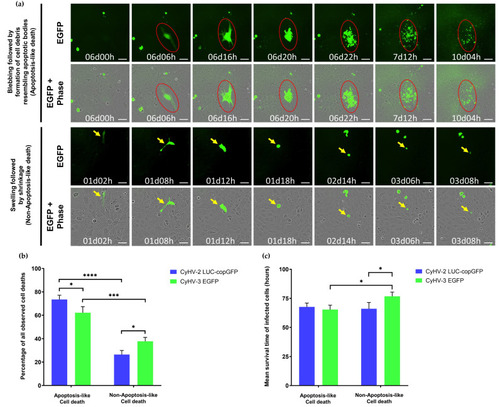
Cell death characteristics observed in CyHV-2 and CyHV-3 infections (a) Representative morphological observations among populations of infected cells (those exhibiting fluorescence) in the periods leading up to cell death (disappearance of fluorescence). Top panel: Morphological features consistent with apoptosis (cell shrinkage, membrane blebbing followed by the appearance of cell debris resembling apoptotic bodies, and progressive decrease of fluorescent signal). Bottom panel: Morphological features not consistent with apoptosis (cell swelling, followed by cell shrinkage, and absence of cell debris resembling apoptotic bodies prior to disappearance of fluorescent signal). Key examples of individual cells undergoing apoptosis-like and non-apoptosis-like death in each panel are highlighted by red circle and yellow arrows, respectively, which track the progression of morphology in a single cell with respect to time. Time postinfection (in days and hours) is indicated in images. Scale bars = 100 µm. (b) Percentage of infected cells exhibiting features of apoptosis-like or non-apoptosis-like cell death among those that died during the observation period (c) Mean survival time of infected cells undergoing cell death during the observation period according to the type of death observed. Data represents mean ± standard error from 3 replicates. **** p < 0.0001; *** p < 0.001; * p < 0.05. |
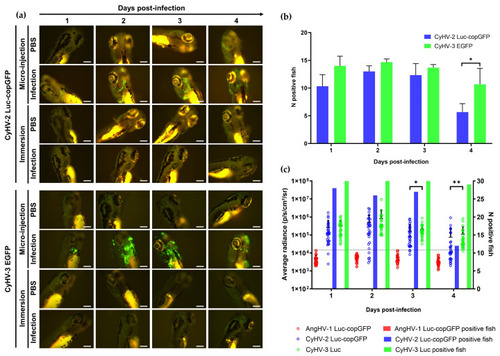
Susceptibility and permissivity of zebrafish larvae to infection with cypriniviruses after inoculation by microinjection (a) Epifluorescence microscopy images representative of larvae inoculated with CyHV-2 and CyHV-3 according to time postinfection (longitudinal observation of the same larvae over all timepoints) Scale bars = 200 µm. (b) Numbers of CyHV-2 and CyHV-3-infected larvae among groups inoculated by microinjection (n = 15). Data represents mean ± standard errors from 3 independent experiments (longitudinal observation of the same larvae over all timepoints). (c) Levels of AngHV-1, CyHV-2 and CyHV-3 detected in infected larvae according to time postinfection based on Luc2 signal expressed by viral recombinants. The data points represent the mean radiance per larvae according to time postinfection with mean ± standard error represented for each group at each timepoint (n = 30). The discontinuous line represents the cut-off for positivity and represents the mean + 3 × SD of the values obtained for mock-infected larvae. The number of positive larvae at each timepoint is represented by bars. * p < 0.05; ** p < 0.01. |
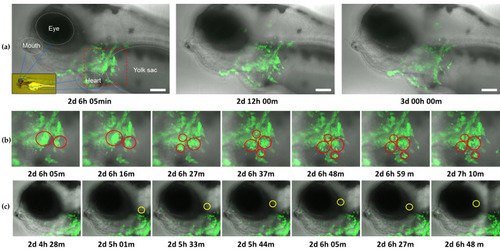
Frames from timelapse video of CyHV-3 EGFP infection in zebrafish larvae from 2–3 dpi (Video S1). The video represents overlay of brightfield/transmission and EGFP fluorescence (green). Time postinfection (in days, hours, and minutes) is indicated under each frame. (a) Entire field of view from light-sheet microscopy. For the purposes of visual orientation, identifiable anatomical features and corresponding locations within larvae body (inset image) are indicated in the first panel. Images show that the infection is primarily localized around the inoculation site (red square), and a decrease in viral levels from 2.5–3 dpi. Scale bars = 100 µm. (b) Enlarged images of the area within red square in (a), representing key examples of apoptosis-like death occurring among large numbers of infected cells (red circles) around the inoculation site, with such events primarily characterized by blebbing followed by the appearance of cell debris resembling apoptotic bodies (c) Key example of highly motile infected cell (highlighted with yellow circle), migrating away from the site of inoculation. |
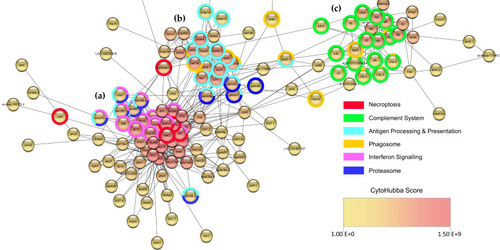
Network representing the functional associations between some of the top 250 most significant DEGs at 2 dpi. Using STRING protein query function in Cytoscape, 208 of the top 250 most significant DEGs were identified and scored based on functional association with each other. These data were used to generate a network in Cytoscape, which was then arranged based on GeneMania force directed layout. Each DEG is represented by a node, with edges (connecting lines) representing functional association. The largest contiguous network resulting from this analysis (136 nodes and 696 edges) is displayed. For visualization purposes, nodes in the peripheral regions of the network (representing DEGs LOC100006895, rnasel3, ndrg1b, pde6ha, and serpinb1l1) were omitted. This resulted in one large cluster (a), and two smaller clusters (b) and (c). STRING functional enrichment analysis indicated that most DEGs in this network were related to the immune response to infection (S6), and genes were labelled based on the main types of gene-set categories enriched in each of their respective clusters. This revealed distinct functions associated with each gene cluster, for example (a) interferon and PRR signalling, (b) antigen processing and presentation, and (c) complement response. The network was also analysed by CytoHubba, which was used to identify the potentially most important hub nodes within the network, with each node scored and coloured based on maximal clique centrality within the network, according to the CytoHubba score colour scale provided; however, this is better represented in S5, with corresponding CytoHubba scores in Table S7. |
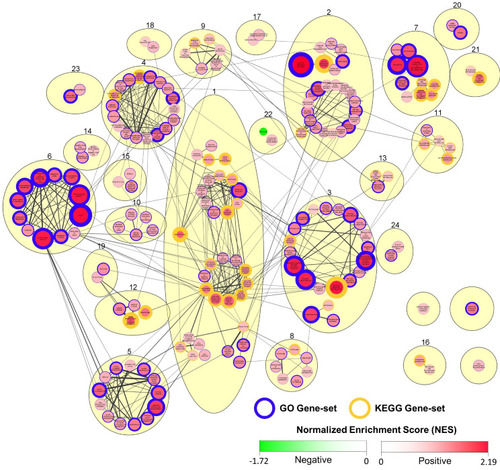
Summary of GSEA output indicating gene-set enrichment based on gene expression in CyHV-3-infected relative to mock-infected zebrafish larvae at 2 dpi. Cytoscape Network representing functional relationships between all significantly enriched gene-sets (positive or negative) identified in GSEA output (FDR adjusted |
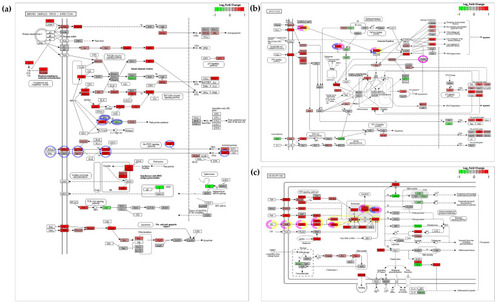
Visualization of differential gene expression in CyHV-3-infected zebrafish larvae (2 dpi) within KEGG pathway maps. Using the R package Pathview, gene expression data from our experiment was mapped to corresponding nodes in KEGG pathways (a) Herpes simplex virus 1 infection (b) Apoptosis and (c) Necroptosis pathways. Nodes represent zebrafish homologs of genes known to be involved in each pathway, with colour representing the log2-fold-change in gene expression in CyHV-3-infected relative to mock infected zebrafish larvae. Upregulated and downregulated genes are represented by red and green shades respectively, according to scale in the top right of each pathway. For visual clarity (due to large differences in fold change between genes) the maximum and minimum values in the colour scale is set at –1 and 1 log2-fold-change (corresponding to a two-fold change). It should be noted that many nodes represent combined differential expression from several zebrafish paralogs, thus the generic KEGG gene symbols are used as node names, which relate to the common names used to refer to protein products at each node. Not all the paralogs represented by each node are significantly differentially regulated. The list of zebrafish orthologs/paralogs corresponding to each node in these pathways can be accessed in the KEGG database using the corresponding gene-set references (Herpes simplex virus 1 infection (DRE05168), Apoptosis (DRE04210) and Necroptosis (DRE04217)), which can then be cross-referenced with data in Table S5 (using NCBI/Entrez/GenBank Gene IDs or Gene Symbols). Key genes involved in IFN-stimulated PKR-mediated programmed cell death, i.e., translational inhibition [114,116,128] leading to apoptosis [112] (blue), IFN-stimulated PKR-mediated apoptosis [129,130] (pink), and IFN-stimulated PKR-mediated necroptosis [113] (yellow) are highlighted. Genes with dashed line borders indicate instances where downregulation, translational inhibition or post-translational inactivation of protein products promote the processes in question (see main text and references provided within this caption for details). White nodes represent instances where zebrafish homologs have not been assigned thus far, or where gene expression from zebrafish homologs have not been detected. Higher quality figures for the whole manuscript are available in the PDF version. |
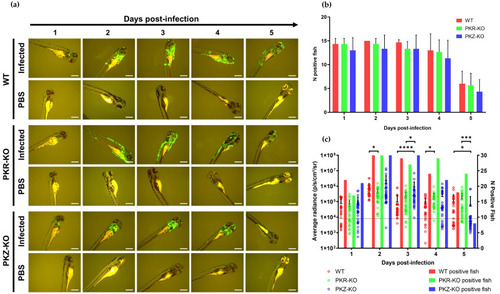
Replication of CyHV-3 in different zebrafish strains. (a) Epifluorescence microscopy images representative of larvae inoculated by microinjection with either CyHV-3 EGFP or mock-inoculated with PBS according to time postinfection (longitudinal observation of the same larvae over all timepoints). For all strains infection clearance commenced from 4–5 dpi. Scale bars = 500 µm. (b) Numbers of infected larvae among zebrafish strains inoculated with CyHV-3 EGFP (n = 15). Data represents mean ± standard errors from 3 independent experiments (longitudinal observation of the same larvae over all timepoints). (c) IVIS analysis measuring Luc2 expression in different zebrafish strains microinjected with CyHV-3 Luc (n = 30). The data points represent the mean radiance per larvae according to time postinfection with mean ± standard error represented for each group at each timepoint. The discontinuous line represents the cut-off for positivity and the mean + 3 × SD of the values obtained for mock-infected larvae. The number of positive larvae at each timepoint is represented by bars. * p < 0.05; *** p < 0.001; **** p < 0.0001. |