
|
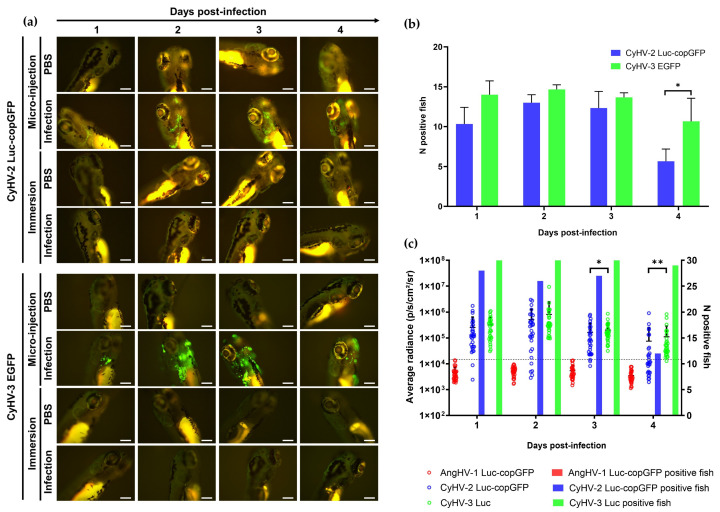
Figure 7
Susceptibility and permissivity of zebrafish larvae to infection with cypriniviruses after inoculation by microinjection (a) Epifluorescence microscopy images representative of larvae inoculated with CyHV-2 and CyHV-3 according to time postinfection (longitudinal observation of the same larvae over all timepoints) Scale bars = 200 µm. (b) Numbers of CyHV-2 and CyHV-3-infected larvae among groups inoculated by microinjection (n = 15). Data represents mean ± standard errors from 3 independent experiments (longitudinal observation of the same larvae over all timepoints). (c) Levels of AngHV-1, CyHV-2 and CyHV-3 detected in infected larvae according to time postinfection based on Luc2 signal expressed by viral recombinants. The data points represent the mean radiance per larvae according to time postinfection with mean ± standard error represented for each group at each timepoint (n = 30). The discontinuous line represents the cut-off for positivity and represents the mean + 3 × SD of the values obtained for mock-infected larvae. The number of positive larvae at each timepoint is represented by bars. * p < 0.05; ** p < 0.01.