
|
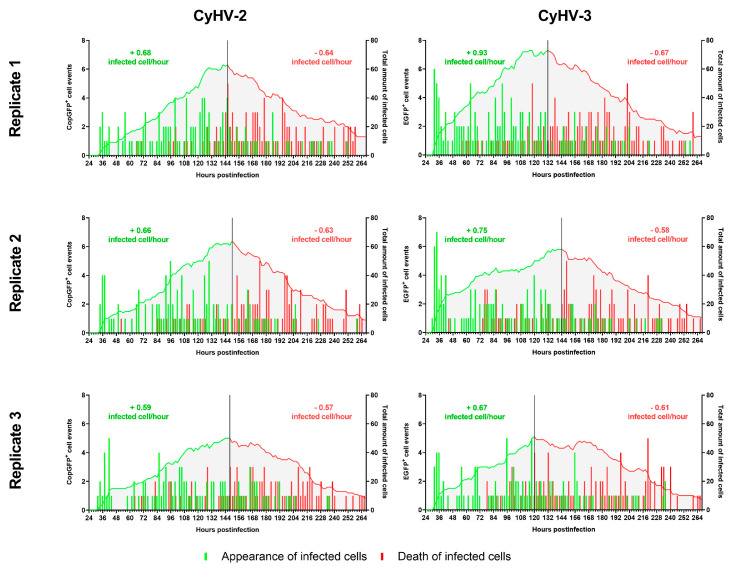
Figure 4
Kinetics of appearance and death of CyHV-2 and CyHV-3-infected cells before and after infection peak. The bars relate to the temporal pattern of appearance and disappearance of CyHV-2-infected or CyHV-3-infected cells (based on fluorescent reporter expression). The quantities are based on the total amount of observations made in 9 different locations in each well/replicate. The green and red curves show the total amount of infected cells up until the peak of infection (represented by the black vertical line) and after the peak, respectively. The values on top of the curves represent the average rate of appearance of infected cells per hour (green) and the average rate of death per hour (red). Analysing the rate of appearance/hour before the peak for CyHV-2 and CyHV-3 revealed no differences between the viruses.