
Figure 11
- ID
- ZDB-FIG-230402-11
- Publication
- Streiff et al., 2023 - Susceptibility and Permissivity of Zebrafish (Danio rerio) Larvae to Cypriniviruses
- Other Figures
- All Figure Page
- Back to All Figure Page
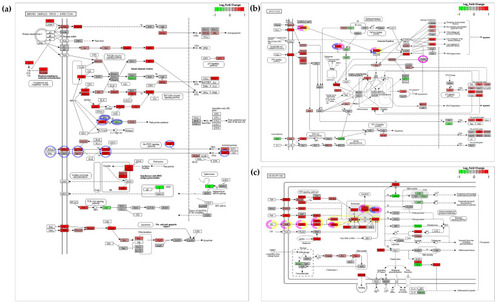
Visualization of differential gene expression in CyHV-3-infected zebrafish larvae (2 dpi) within KEGG pathway maps. Using the R package Pathview, gene expression data from our experiment was mapped to corresponding nodes in KEGG pathways (a) Herpes simplex virus 1 infection (b) Apoptosis and (c) Necroptosis pathways. Nodes represent zebrafish homologs of genes known to be involved in each pathway, with colour representing the log2-fold-change in gene expression in CyHV-3-infected relative to mock infected zebrafish larvae. Upregulated and downregulated genes are represented by red and green shades respectively, according to scale in the top right of each pathway. For visual clarity (due to large differences in fold change between genes) the maximum and minimum values in the colour scale is set at –1 and 1 log2-fold-change (corresponding to a two-fold change). It should be noted that many nodes represent combined differential expression from several zebrafish paralogs, thus the generic KEGG gene symbols are used as node names, which relate to the common names used to refer to protein products at each node. Not all the paralogs represented by each node are significantly differentially regulated. The list of zebrafish orthologs/paralogs corresponding to each node in these pathways can be accessed in the KEGG database using the corresponding gene-set references (Herpes simplex virus 1 infection (DRE05168), Apoptosis (DRE04210) and Necroptosis (DRE04217)), which can then be cross-referenced with data in Table S5 (using NCBI/Entrez/GenBank Gene IDs or Gene Symbols). Key genes involved in IFN-stimulated PKR-mediated programmed cell death, i.e., translational inhibition [114,116,128] leading to apoptosis [112] (blue), IFN-stimulated PKR-mediated apoptosis [129,130] (pink), and IFN-stimulated PKR-mediated necroptosis [113] (yellow) are highlighted. Genes with dashed line borders indicate instances where downregulation, translational inhibition or post-translational inactivation of protein products promote the processes in question (see main text and references provided within this caption for details). White nodes represent instances where zebrafish homologs have not been assigned thus far, or where gene expression from zebrafish homologs have not been detected. Higher quality figures for the whole manuscript are available in the PDF version. |