Image
Figure Caption
Figure 5
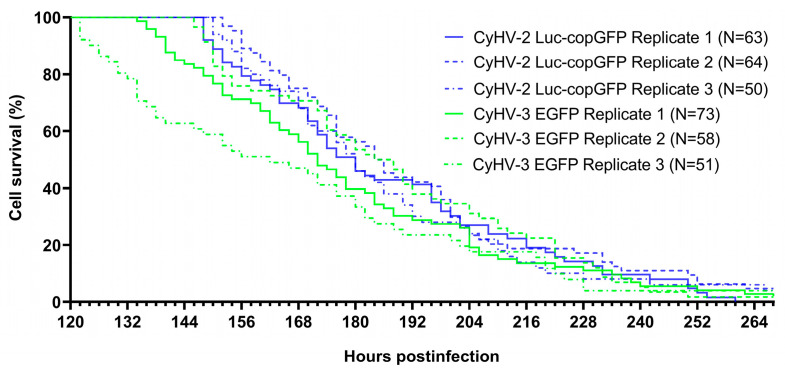
Survival kinetics for CyHV-2 and CyHV-3-infected cells displayed as Kaplan-Meier plots. CyHV-2 and CyHV-3-infected cells observed at 120 hpi were monitored until the end of the experiment. Cell death events and times were identified based on the disappearance of fluorescent signals (Figure S2). N = Number of cells followed.
Acknowledgments
This image is the copyrighted work of the attributed author or publisher, and
ZFIN has permission only to display this image to its users.
Additional permissions should be obtained from the applicable author or publisher of the image.
Full text @ Viruses

