
- Title
-
Protective Effects of Lactobacillus gasseri against High-Cholesterol Diet-Induced Fatty Liver and Regulation of Host Gene Expression Profiles
- Authors
- He, T., Lykov, N., Luo, X., Wang, H., Du, Z., Chen, Z., Chen, S., Zhu, L., Zhao, Y., Tzeng, C.
- Source
- Full text @ Int. J. Mol. Sci.
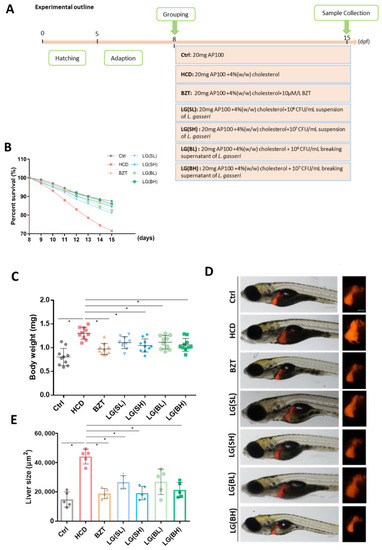
Effects of L. gasseri on high cholesterol diet (HCD)-induced mortality and liver morphological changes of zebrafish larvae. (A) Experimental outline of the feeding protocols. (B) Percent survival of zebrafish larvae from 8 to 15 days post fertilization (dpf), n = 30. (C) Body weight was measured at 15 dpf (n = 10). (D) Representative images of morphological alterations of transgenic zebrafish Tg (lfabp10:dsRed) liver under the same subdivided groups. The liver was labeled with DsRed. Scale bars = 100 µm. (E) Quantification of the liver size of Tg (lfabp10: dsRed) in each group, n = 5. Data were represented as mean ± SD. * p < 0.05. |
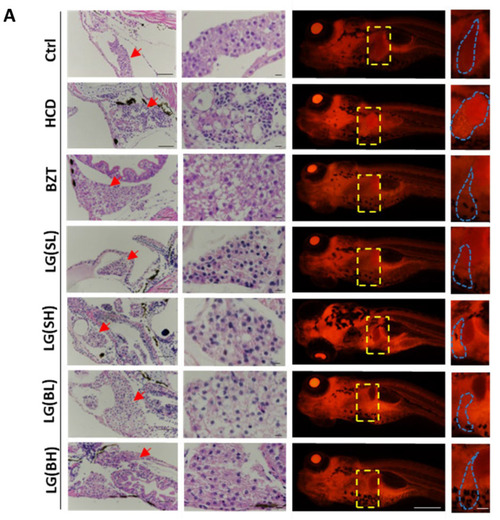
Effects of L. gasseri on HCD-induced fatty liver on lipid accumulation and histological changes in zebrafish larvae. (A) H&E staining and Nile red staining. Zebrafish livers were indicated with the red arrows in H&E sections and framed with a yellow box in Nile red sections. Scale bars = 100 µm. (B) Qualifications of Nile red staining by the relative red fluorescence intensity using ImageJ (n = 5). Data were represented as mean ± SD. * p < 0.05. |
Effects of L. gasseri on HCD-induced fatty liver on lipid accumulation and histological changes in zebrafish larvae. (A) H&E staining and Nile red staining. Zebrafish livers were indicated with the red arrows in H&E sections and framed with a yellow box in Nile red sections. Scale bars = 100 µm. (B) Qualifications of Nile red staining by the relative red fluorescence intensity using ImageJ (n = 5). Data were represented as mean ± SD. * p < 0.05. |
Effects of |
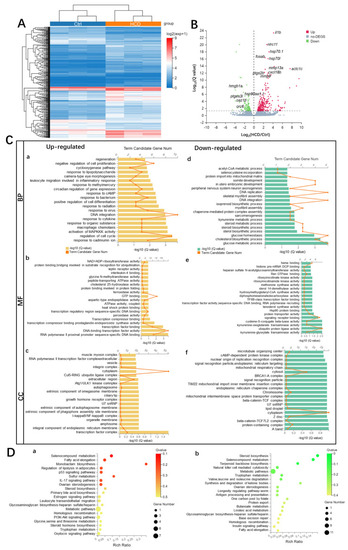
Transcriptome profiling of HCD-induced alternations of gene expression during liver injury in zebrafish larvae. (A) Hierarchical clustering of RNA-Sequencing data showed differentially expressed genes (DEGs) between Ctrl and HCD-induced groups (|log2FC| > 0, Q value < 0.05) by Pearson correlation method without mean centering. High and low levels of gene expression were represented by red and blue. (B) Volcano plots of identified DEGs of log2 (fold change) versus-log10 (Q value). The up-regulated DEGs are indicated with red dots, and the down-regulated DEGs are indicated with blue dots. Grey dots represent non-DEGs. (C) GO annotation, including biological process (BP) (a,d), molecular function (MF) (b,e) and cellular component (CC) (c,f) were characterized by DAVID analysis. (D) KEGG pathway analysis of DEGs. The top 20 enriched KEGG pathways associated with up- and down-regulated mRNA transcripts were presented in bar charts (a,b). Q < 0.05 were considered to be enriched. |
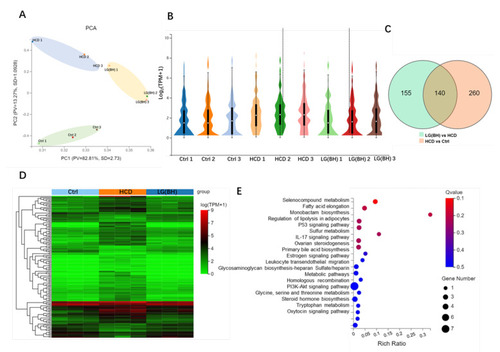
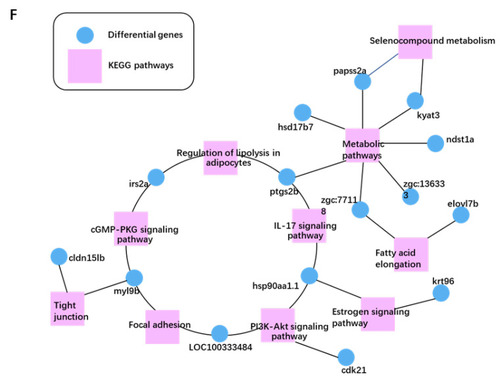
Transcriptomic analysis of gene expression pattern after L. gasseri administration. (A) Principal component analysis (PCA) of the samples, including Ctrl, HCD and LG (BH). (B) Violin plot displayed the distribution of log2 (TPM + 1) of gene expressed in each group. TPM, transcript per million. The white dot marks the mean value of the distribution, and the black bar corresponds to the 25th (bottom) and 75th (top) percentile range. (C) Venn diagram showed the overlapping DEGs between HCD vs. Ctrl and LG (BH) vs. HCD (|log2FC| > 0, Q value < 0.05). (D) Differential cluster heat map of fold change (log2 fold change) of the overlapping 140 DEGs using Pearson correlation method without mean centering. (E) KEGG enrichment of the overlapping 140 DEGs. (F) The top 10 KEGG pathway relationship network with the largest node connections number of genes. The correlated pathways and genes were connected by black edges. |
Transcriptomic analysis of gene expression pattern after L. gasseri administration. (A) Principal component analysis (PCA) of the samples, including Ctrl, HCD and LG (BH). (B) Violin plot displayed the distribution of log2 (TPM + 1) of gene expressed in each group. TPM, transcript per million. The white dot marks the mean value of the distribution, and the black bar corresponds to the 25th (bottom) and 75th (top) percentile range. (C) Venn diagram showed the overlapping DEGs between HCD vs. Ctrl and LG (BH) vs. HCD (|log2FC| > 0, Q value < 0.05). (D) Differential cluster heat map of fold change (log2 fold change) of the overlapping 140 DEGs using Pearson correlation method without mean centering. (E) KEGG enrichment of the overlapping 140 DEGs. (F) The top 10 KEGG pathway relationship network with the largest node connections number of genes. The correlated pathways and genes were connected by black edges. |
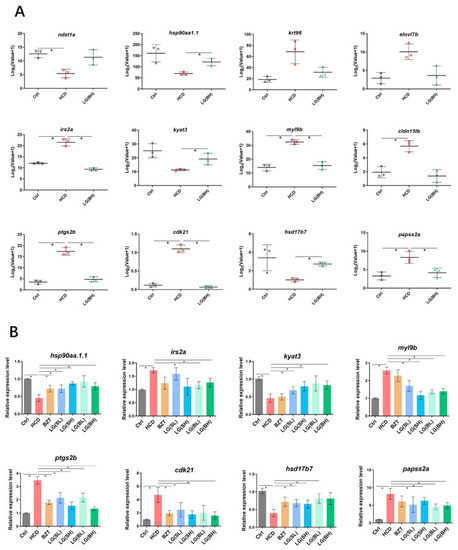
The expression of identified genes at key junction nodes in KEGG pathway relationship network. (A) The RNA-sequencing analysis of the expression of hsp90aa1.1, kyat3, hsd17b7, irs2a, myl9b, ptgs2b, cdk21 and papss2a in experimental groups. (B) Validation of screened genes by qRT-PCR test. Log2 (fold change) between treatment samples and control were calculated by the −∆∆CT method of three biologically independent replicates. Data are shown as the means ± SD. * p < 0.05. |