
Figure 5
- ID
- ZDB-FIG-230217-140
- Publication
- He et al., 2023 - Protective Effects of Lactobacillus gasseri against High-Cholesterol Diet-Induced Fatty Liver and Regulation of Host Gene Expression Profiles
- Other Figures
- All Figure Page
- Back to All Figure Page
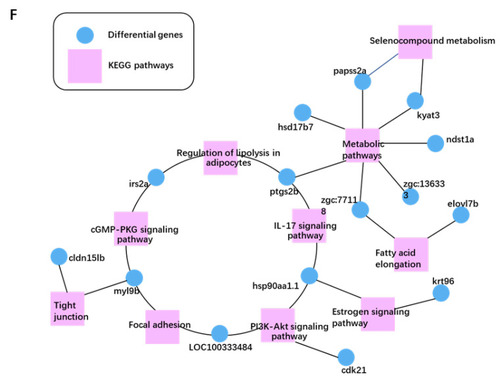
Transcriptomic analysis of gene expression pattern after L. gasseri administration. (A) Principal component analysis (PCA) of the samples, including Ctrl, HCD and LG (BH). (B) Violin plot displayed the distribution of log2 (TPM + 1) of gene expressed in each group. TPM, transcript per million. The white dot marks the mean value of the distribution, and the black bar corresponds to the 25th (bottom) and 75th (top) percentile range. (C) Venn diagram showed the overlapping DEGs between HCD vs. Ctrl and LG (BH) vs. HCD (|log2FC| > 0, Q value < 0.05). (D) Differential cluster heat map of fold change (log2 fold change) of the overlapping 140 DEGs using Pearson correlation method without mean centering. (E) KEGG enrichment of the overlapping 140 DEGs. (F) The top 10 KEGG pathway relationship network with the largest node connections number of genes. The correlated pathways and genes were connected by black edges. |