
Figure 4
- ID
- ZDB-FIG-230217-137
- Publication
- He et al., 2023 - Protective Effects of Lactobacillus gasseri against High-Cholesterol Diet-Induced Fatty Liver and Regulation of Host Gene Expression Profiles
- Other Figures
- All Figure Page
- Back to All Figure Page
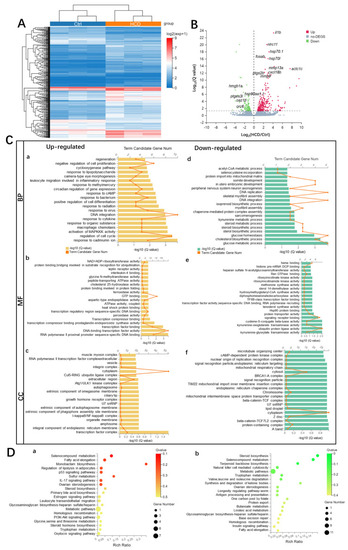
Transcriptome profiling of HCD-induced alternations of gene expression during liver injury in zebrafish larvae. (A) Hierarchical clustering of RNA-Sequencing data showed differentially expressed genes (DEGs) between Ctrl and HCD-induced groups (|log2FC| > 0, Q value < 0.05) by Pearson correlation method without mean centering. High and low levels of gene expression were represented by red and blue. (B) Volcano plots of identified DEGs of log2 (fold change) versus-log10 (Q value). The up-regulated DEGs are indicated with red dots, and the down-regulated DEGs are indicated with blue dots. Grey dots represent non-DEGs. (C) GO annotation, including biological process (BP) (a,d), molecular function (MF) (b,e) and cellular component (CC) (c,f) were characterized by DAVID analysis. (D) KEGG pathway analysis of DEGs. The top 20 enriched KEGG pathways associated with up- and down-regulated mRNA transcripts were presented in bar charts (a,b). Q < 0.05 were considered to be enriched. |