
Image
|
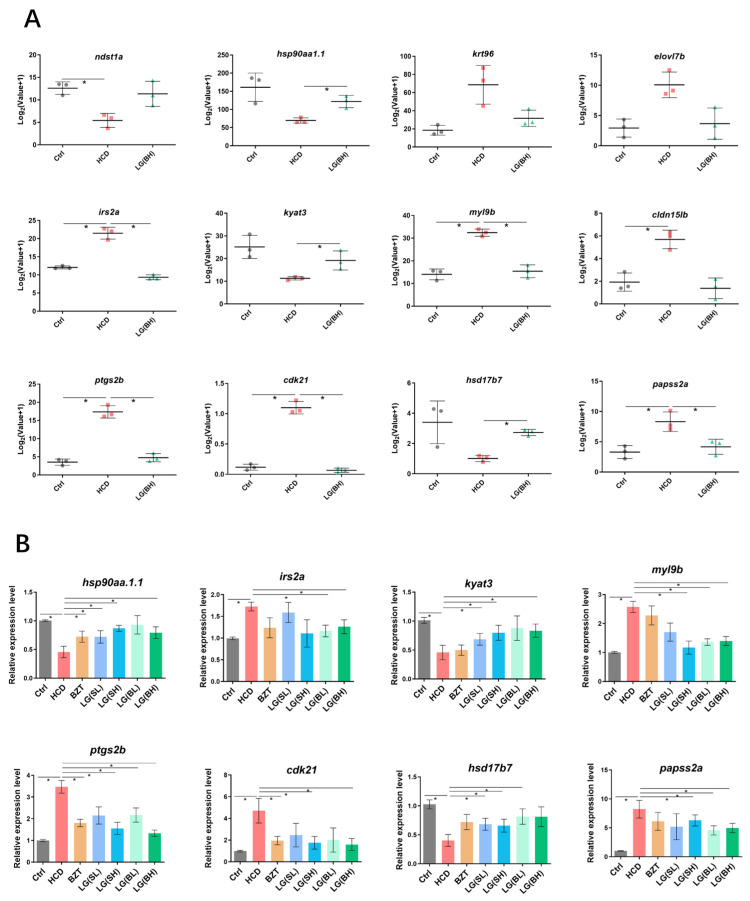
Figure Caption
Figure 6
The expression of identified genes at key junction nodes in KEGG pathway relationship network. (A) The RNA-sequencing analysis of the expression of hsp90aa1.1, kyat3, hsd17b7, irs2a, myl9b, ptgs2b, cdk21 and papss2a in experimental groups. (B) Validation of screened genes by qRT-PCR test. Log2 (fold change) between treatment samples and control were calculated by the −∆∆CT method of three biologically independent replicates. Data are shown as the means ± SD. * p < 0.05.
Acknowledgments
This image is the copyrighted work of the attributed author or publisher, and
ZFIN has permission only to display this image to its users.
Additional permissions should be obtained from the applicable author or publisher of the image.
Full text @ Int. J. Mol. Sci.