
Image
|
Figure Caption
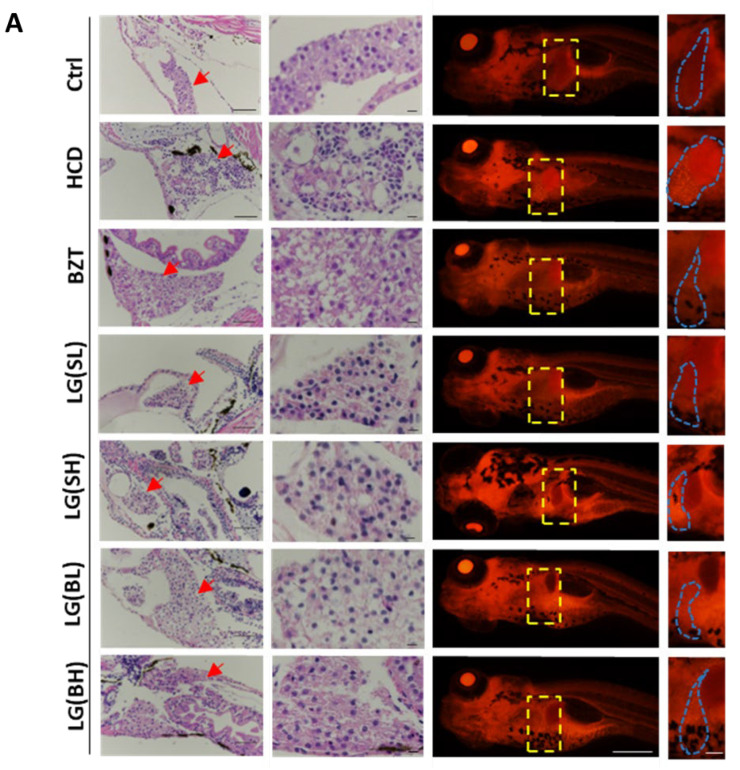
Figure 2
Effects of L. gasseri on HCD-induced fatty liver on lipid accumulation and histological changes in zebrafish larvae. (A) H&E staining and Nile red staining. Zebrafish livers were indicated with the red arrows in H&E sections and framed with a yellow box in Nile red sections. Scale bars = 100 µm. (B) Qualifications of Nile red staining by the relative red fluorescence intensity using ImageJ (n = 5). Data were represented as mean ± SD. * p < 0.05.
Acknowledgments
This image is the copyrighted work of the attributed author or publisher, and
ZFIN has permission only to display this image to its users.
Additional permissions should be obtained from the applicable author or publisher of the image.
Full text @ Int. J. Mol. Sci.