
- Title
-
Dand5 is involved in zebrafish tailbud cell movement
- Authors
- Bota, C., Martins, G.G., Lopes, S.S.
- Source
- Full text @ Front Cell Dev Biol
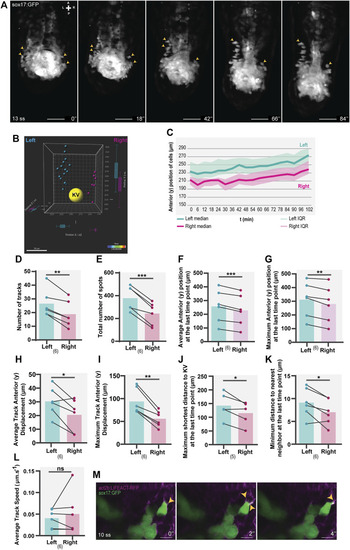
Asymmetric patterns of NKSTCs in WT embryos. (A) Time-lapse images of selected time points of a Tg(sox17:GFP) embryo starting at 13 ss and ending at 18 ss. Yellow arrowheads indicate the more anterior positions on the left and right sides. The elapsed time is indicated in minutes (‘) at the bottom-right. Scale bar = 50 µm. (B) 3D distribution of manually tracked cells at the last time-point imaged. Left spots are shown in cyan, right in magenta, and the KV lumen in yellow. (C) Dynamics of the anterior positions at consecutive time points on the left (cyan) and right (magenta) sides. The thick lines represent the medians. (D–L) Left vs right parameters extracted from cell tracking data, cyan represents the left side, and magenta represents the right side. t-test paired comparisons and IQR means interquartile range. Bars represent mean values and dots represent individual embryos. *corresponds to a p-value <0.05; ** to a p-value <0.005 and *** to a p-value <0.0005. (M) Lamellipodium-like (yellow arrowheads) structures in NKSTCs observed in Tg(act2b:LIFEACT-RFP);Tg(sox17:GFP). Scale bar = 10 µm. Axes indicate A, anterior; P, posterior; L, left; R, right. N is shown in parentheses. |
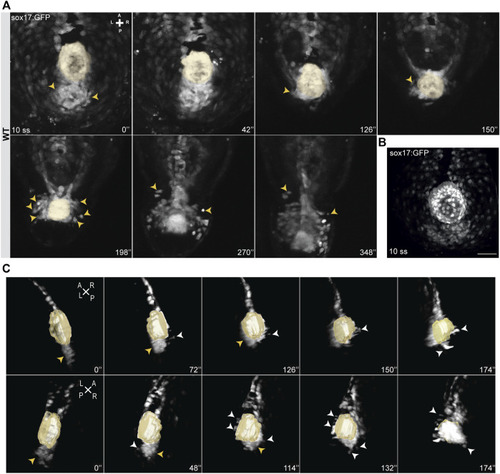
Snapshots from time-lapse live imaging of NKSTCs. (A) Time-lapse imaging of a WT Tg (sox17:GFP) embryo, starting at 10 ss, showing NKSTCs movement from a posterior cluster aligned with the KV. NKSTCs are firstly indicated by yellow arrowheads in the cluster. In the following snapshots, the yellow arrowheads show the first cells that exit the cluster and migrate towards the anterior side from either the left or right side. (B) Maximum intensity projection of a 10 ss Tg(sox17:GFP) fixed embryo showing the ´posterior cluster’ aligned with the KV, scale bar = 50 µm. (C) 3D lateral views of the KV and posterior cluster at 10 ss. Left, yellow arrowheads; right, white arrowheads. Elapsed time is indicated in minutes (‘) at the right and axes are indicated: A, anterior; P, posterior; L, left; R, right. N is shown in parentheses. |

Quantification of NKSTCs distribution patterns in WT and dand5 −/− embryos. (A) Schematic representation of early asymmetric establishment in WT and dand5 −/− embryos. In the absence of dand5 expression, Spaw freely travels to both sides of the LPM, where it activates its own expression and its inhibitor lefty1 at the midline. (B) Quantification of left-right differences in the number of NKSTCs at 14 ss in WT and dand5 −/− embryos. (C) Quantification of differences in the number of NKSTCs observed on each side of the embryos at 14 ss in WT and dand5 −/− embryos. (D) Quantification of left-right differences observed in the anterior distance to the KV based on the 3D coordinates of NKSTCs at 14 ss in WT and dand5 −/− embryos. Cyan represents the left side, and magenta represents the right side. t-test paired and unpaired comparisons. Bars represent mean values, and dots represent individual embryos. * Corresponds to a p-value <0.05. |
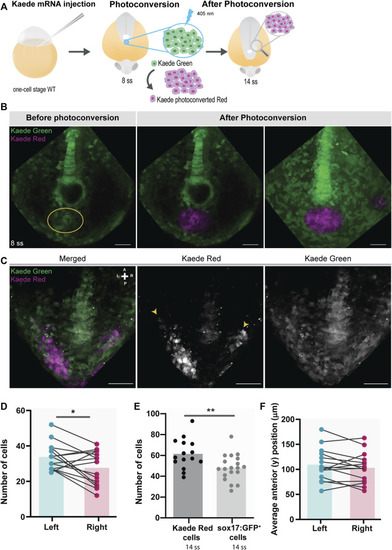
Testing for the presence of left-right asymmetries independent of the Tg(sox17:GFP) reporter line. (A) Schematic representation of the setup used to follow specific tailbud cells using the photoconvertible protein, Kaede. One-cell stage WT embryos were injected with Kaede mRNA. The ‘posterior cluster’ region was blindly photoconverted at 8 ss embryos using UV light. At 14 ss, embryos were screened for the location of Kaede photoconverted cells. (B) Before and after Kaede photoconversion of the ‘posterior cluster’ region at 8 ss in WT embryos. The KV middle focal plane was used as a reference (note that photoconversion can happen along the axial cone of illumination of the confocal, though). The maximum intensity projection shows the total area of the photoconverted cells. Kaede green cells are shown in green, and Kaede photoconverted cells are shown in magenta. Scale bar = 50 µm. (C) Position of the Kaede photoconverted cells in the dorsal view of a 14 ss WT embryo. Yellow arrowheads indicate the more anterior positions of the photoconverted cells on both the left and right sides. Scale bar = 100 µm. (D) Paired comparison of the number of photoconverted cells on the left and right side at 14 ss. (E) Quantification of the differences in the total number of photoconverted cells and NKSTCs at 14 ss. Dark gray represents photoconverted cells and light gray represents NKSTCs. (F) Paired comparison of the average anterior positions of photoconverted cells on the left and right sides of 14 ss. Cyan represents the left side and magenta represents the right side. Bars represent mean values and dots individual embryos. * corresponds to a p-value <0.05 and ** to a p-value <0.005. |
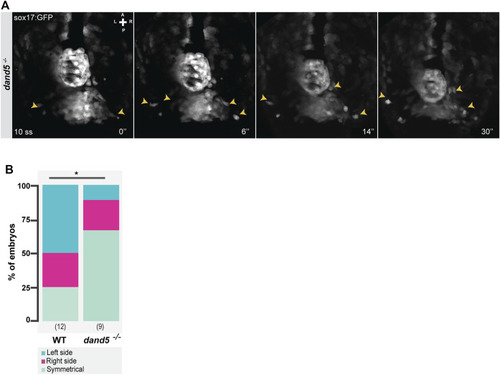
Snapshots from time-lapse live imaging of NKSTCs leaving the posterior cluster. (A) Time-lapse imaging of a dand5 −/− embryo raised on a Tg(sox17:GFP) background, starting at 10 ss. (B) Quantification of the first side from which NKSTCs departed from the posterior cluster in WT and dand5 −/− embryos. Chi-square test. * corresponds to a p-value <0.05. Elapsed time is indicated in minutes (‘) at the bottom right, and the axes are indicated: A, anterior; P, posterior; L, left; R, right. N is shown in parentheses. |
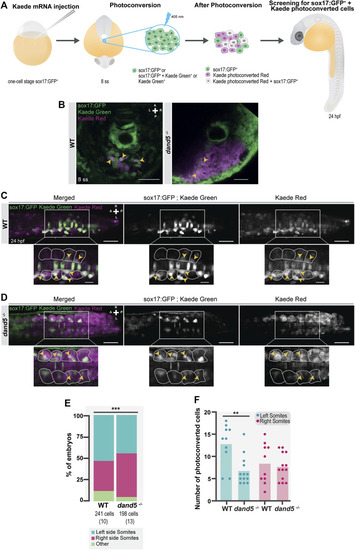
NKSTCs fate mapping. (A) Schematic representation of the fate map setup using the photoconvertible protein, Kaede. One-cell stage Tg (sox17:GFP) embryos were injected with Kaede mRNA. The “posterior cluster” was photoconverted at 8 ss embryos using UV light. After photoconversion, there were three populations of cells in the region of interest: sox17:GFP+ (green), Kaede photoconverted (magenta), and Kaede photoconverted colocalized with sox17:GFP+ (white). At 24 hpf, the embryos were screened for the location of Kaede photoconverted colocalized with sox17:GFP+ cells. The same procedure was used in dand5 −/− embryos in Tg(sox17:GFP) background. (B) Kaede photoconversion of the “posterior cluster” at 8 ss in WT and dand5 −/− embryos. Kaede photoconverted is in magenta; sox17:GFP+ and Kaede not photoconverted are in green and Kaede photoconverted colocalized with sox17:GFP+ cells are shown in white. Scale bar = 50 µm. (C) Dorsal view of a Tg(sox17:GFP) 24 hpf Kaede photoconverted embryo. Scale bar = 50 µm. Magnification shows a region of interest where NKSTCs (yellow arrowheads) are located at both the left and right somites (yellow arrowheads). The somites are outlined by light grey dashed lines. Scale bar = 20 µm. (D) Dorsal view of a dand5 −/− ; Tg(sox17:GFP) 24 hpf Kaede photoconverted embryo. Scale bar = 50 µm. Magnification shows a region of interest where NKSTCs (yellow arrowheads) are located at both the left and right somites (yellow arrowheads). The somites are outlined by light grey dashed lines. Scale bar = 20 µm. (E) Quantification and comparison of the proportion of cells that incorporated somites and ‘other fates’ in both WT and dand5 −/− 24 hpf embryos. Chi-square test. * corresponds to a p-value <0.05. (F) Quantification of the differences in the number of NKSTCs per somite side. Cells on the left and right sides of WT vs dand5 −/− . t-test paired and unpaired comparisons. Bars represent mean values and dots individual embryos. * corresponds to a p-value <0.05 and ** to a p-value <0.005. N is shown in parentheses. |
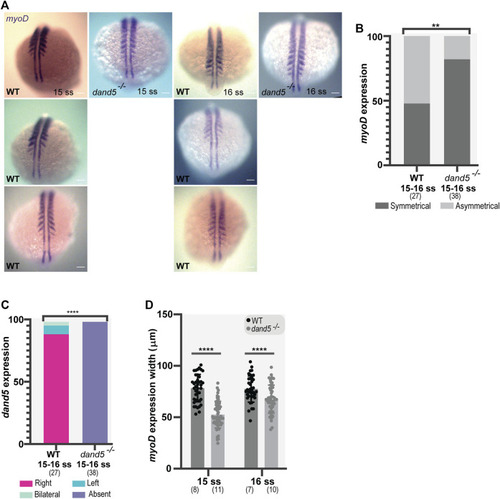
Whole-mount in situ hybridization for myoD and dand5 expression. (A,B) myoD expression and side scoring. (C) Quantification of differences in dand5 expression patterns in WT vs dand5 homozygous mutants. The chi-squared test was used for statistical analysis. (D) Quantification of myoD width in WT and dand5 −/− at 15 and 16 ss embryos. t-test unpaired comparison. Bars represent mean values, and dots represent individual embryos. * corresponds to a p-value <0 05; ** to a p-value <0.005; *** to a p-value <0.0005 and **** to a p-value <0.00005. Scale bar = 100 µm. The top is anterior, and the bottom is posterior. N is shown in parentheses. |
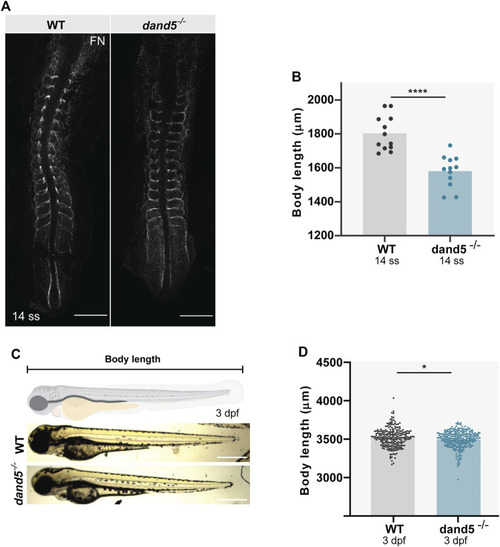
Body size and somite morphology in WT and dand5 −/− embryos. (A) Fibronectin (FN) immunostaining shows somite borders in WT and dand5 −/− embryos at 14 ss. Scale bar = 100 µm. The top is anterior; the bottom is posterior. (B) Comparison of WT and dand5 −/− body length at 14 ss. (C) WT and dand5 −/− 3 dpf larvae and schematic representation of body length measurements. Scale bar = 500 µm. (D) Comparison of body length measurements between WT (N = 234) and dand5 −/− (N = 271) 3 dpf larvae. Gray represents WT embryos, and blue represents dand5 −/− embryos. t-test unpaired comparison. Bars represent mean values, and dots represent individual embryos. * corresponds to a p-value <0.05; **** corresponds to a p-value <0.00005. |
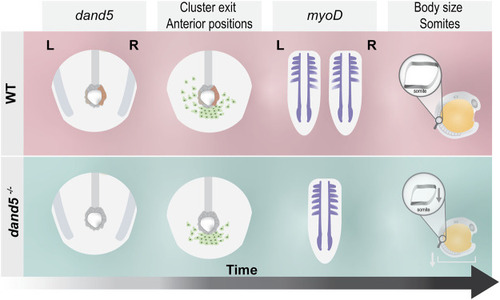
Schematic illustration of the main findings of this study. In WT embryos, dand5 is expressed on the right side of the LRO, NKSTCs exit the posterior cluster first from the left side in 50% of the embryos, and myoD is symmetrical in the same proportion of embryos. In dand5 −/− mutants, which lack dand5 expression, NKSTCs simultaneously depart from the posterior cluster from the left and right sides and acquire symmetrical positions. Later, myoD presumptive somite expression becomes symmetric, accordingly. In addition, in dand5 mutants, the width of the myoD segments was significantly shorter and the body length was decreased. |