
IMAGE
FIGURE 5
- ID
- ZDB-IMAGE-230127-6
- Publication
- Bota et al., 2023 - Dand5 is involved in zebrafish tailbud cell movement
- All Figures
- Figures for Bota et al., 2023
Image
|
Figure Caption
FIGURE 5
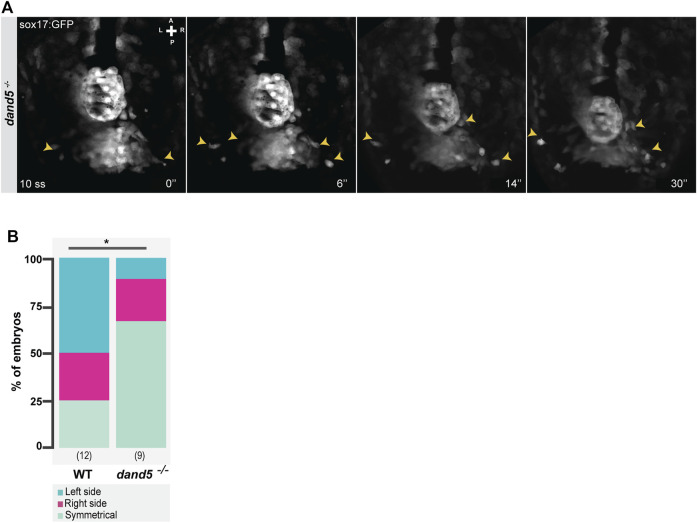
Snapshots from time-lapse live imaging of NKSTCs leaving the posterior cluster. (A) Time-lapse imaging of a dand5 −/− embryo raised on a Tg(sox17:GFP) background, starting at 10 ss. (B) Quantification of the first side from which NKSTCs departed from the posterior cluster in WT and dand5 −/− embryos. Chi-square test. * corresponds to a p-value <0.05. Elapsed time is indicated in minutes (‘) at the bottom right, and the axes are indicated: A, anterior; P, posterior; L, left; R, right. N is shown in parentheses.
Acknowledgments
This image is the copyrighted work of the attributed author or publisher, and
ZFIN has permission only to display this image to its users.
Additional permissions should be obtained from the applicable author or publisher of the image.
Full text @ Front Cell Dev Biol