
FIGURE 8
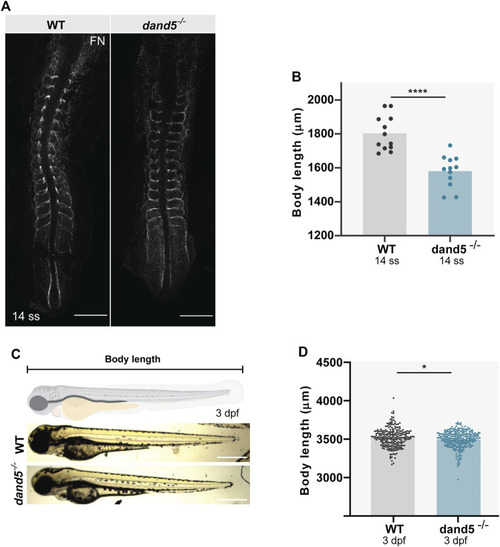
Body size and somite morphology in WT and dand5 −/− embryos. (A) Fibronectin (FN) immunostaining shows somite borders in WT and dand5 −/− embryos at 14 ss. Scale bar = 100 µm. The top is anterior; the bottom is posterior. (B) Comparison of WT and dand5 −/− body length at 14 ss. (C) WT and dand5 −/− 3 dpf larvae and schematic representation of body length measurements. Scale bar = 500 µm. (D) Comparison of body length measurements between WT (N = 234) and dand5 −/− (N = 271) 3 dpf larvae. Gray represents WT embryos, and blue represents dand5 −/− embryos. t-test unpaired comparison. Bars represent mean values, and dots represent individual embryos. * corresponds to a p-value <0.05; **** corresponds to a p-value <0.00005. |