
FIGURE 6
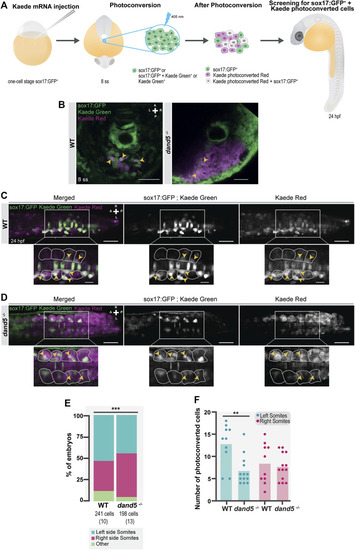
NKSTCs fate mapping. (A) Schematic representation of the fate map setup using the photoconvertible protein, Kaede. One-cell stage Tg (sox17:GFP) embryos were injected with Kaede mRNA. The “posterior cluster” was photoconverted at 8 ss embryos using UV light. After photoconversion, there were three populations of cells in the region of interest: sox17:GFP+ (green), Kaede photoconverted (magenta), and Kaede photoconverted colocalized with sox17:GFP+ (white). At 24 hpf, the embryos were screened for the location of Kaede photoconverted colocalized with sox17:GFP+ cells. The same procedure was used in dand5 −/− embryos in Tg(sox17:GFP) background. (B) Kaede photoconversion of the “posterior cluster” at 8 ss in WT and dand5 −/− embryos. Kaede photoconverted is in magenta; sox17:GFP+ and Kaede not photoconverted are in green and Kaede photoconverted colocalized with sox17:GFP+ cells are shown in white. Scale bar = 50 µm. (C) Dorsal view of a Tg(sox17:GFP) 24 hpf Kaede photoconverted embryo. Scale bar = 50 µm. Magnification shows a region of interest where NKSTCs (yellow arrowheads) are located at both the left and right somites (yellow arrowheads). The somites are outlined by light grey dashed lines. Scale bar = 20 µm. (D) Dorsal view of a dand5 −/− ; Tg(sox17:GFP) 24 hpf Kaede photoconverted embryo. Scale bar = 50 µm. Magnification shows a region of interest where NKSTCs (yellow arrowheads) are located at both the left and right somites (yellow arrowheads). The somites are outlined by light grey dashed lines. Scale bar = 20 µm. (E) Quantification and comparison of the proportion of cells that incorporated somites and ‘other fates’ in both WT and dand5 −/− 24 hpf embryos. Chi-square test. * corresponds to a p-value <0.05. (F) Quantification of the differences in the number of NKSTCs per somite side. Cells on the left and right sides of WT vs dand5 −/− . t-test paired and unpaired comparisons. Bars represent mean values and dots individual embryos. * corresponds to a p-value <0.05 and ** to a p-value <0.005. N is shown in parentheses. |